
GIS for electric utilities means modelling the physical network, substations, feeders, transformers, poles and service points, as a connected, location-aware system that powers outage response, asset management, vegetation risk control, AMI integration and renewable or EV load planning. The strongest electric utility GIS implementations are built on a connectivity-aware utility network model, not a static map, because outage response and load planning both depend on tracing the network, not just viewing it.
- Electric utility GIS has moved from static asset mapping to connectivity-aware network models that can trace, simulate and validate the grid in real time.
- Outage response speed and accuracy depend directly on how well the GIS connects customer service points to the upstream network.
- Vegetation risk, EV load growth and renewable interconnection are now core GIS use cases, not edge cases.
- The biggest implementation risk is treating data migration as a one-off project instead of an ongoing governance discipline.
- AI-assisted feature extraction, digital twins and real-time SCADA integration are now baseline expectations, not differentiators, for serious electric utility GIS in 2026.
Why the Grid Needs GIS More Than Most Networks Do
Every electric utility runs on a network that is, by definition, spatial. A transformer sits at a specific coordinate. A feeder runs along a specific corridor. A customer’s service point connects, through a precise chain of conductors and switches, to a specific upstream substation. None of that can be understood, planned or fixed without location at the centre of the record.
That is the case for Geographic Information Systems in the electric sector, and it has been true for decades. What has changed by 2026 is the depth of what GIS is expected to do. A static map of pole locations was once considered adequate. Today, utilities need a model that can trace current through the network, calculate which customers an outage affects, validate whether a new solar interconnection will overload a transformer, and feed a digital twin that mirrors the grid’s real-time state. RedPlanet Solutions builds and modernises exactly this kind of network model for distribution and transmission operators across multiple regions.
The cost of under-investing here is not abstract. Inaccurate network records lead to misrouted crews, longer outages, missed vegetation risk and connection approvals based on guesswork rather than verified headroom. As grids absorb more rooftop solar, battery storage and electric vehicle charging load, the tolerance for a poorly connected network model keeps shrinking.
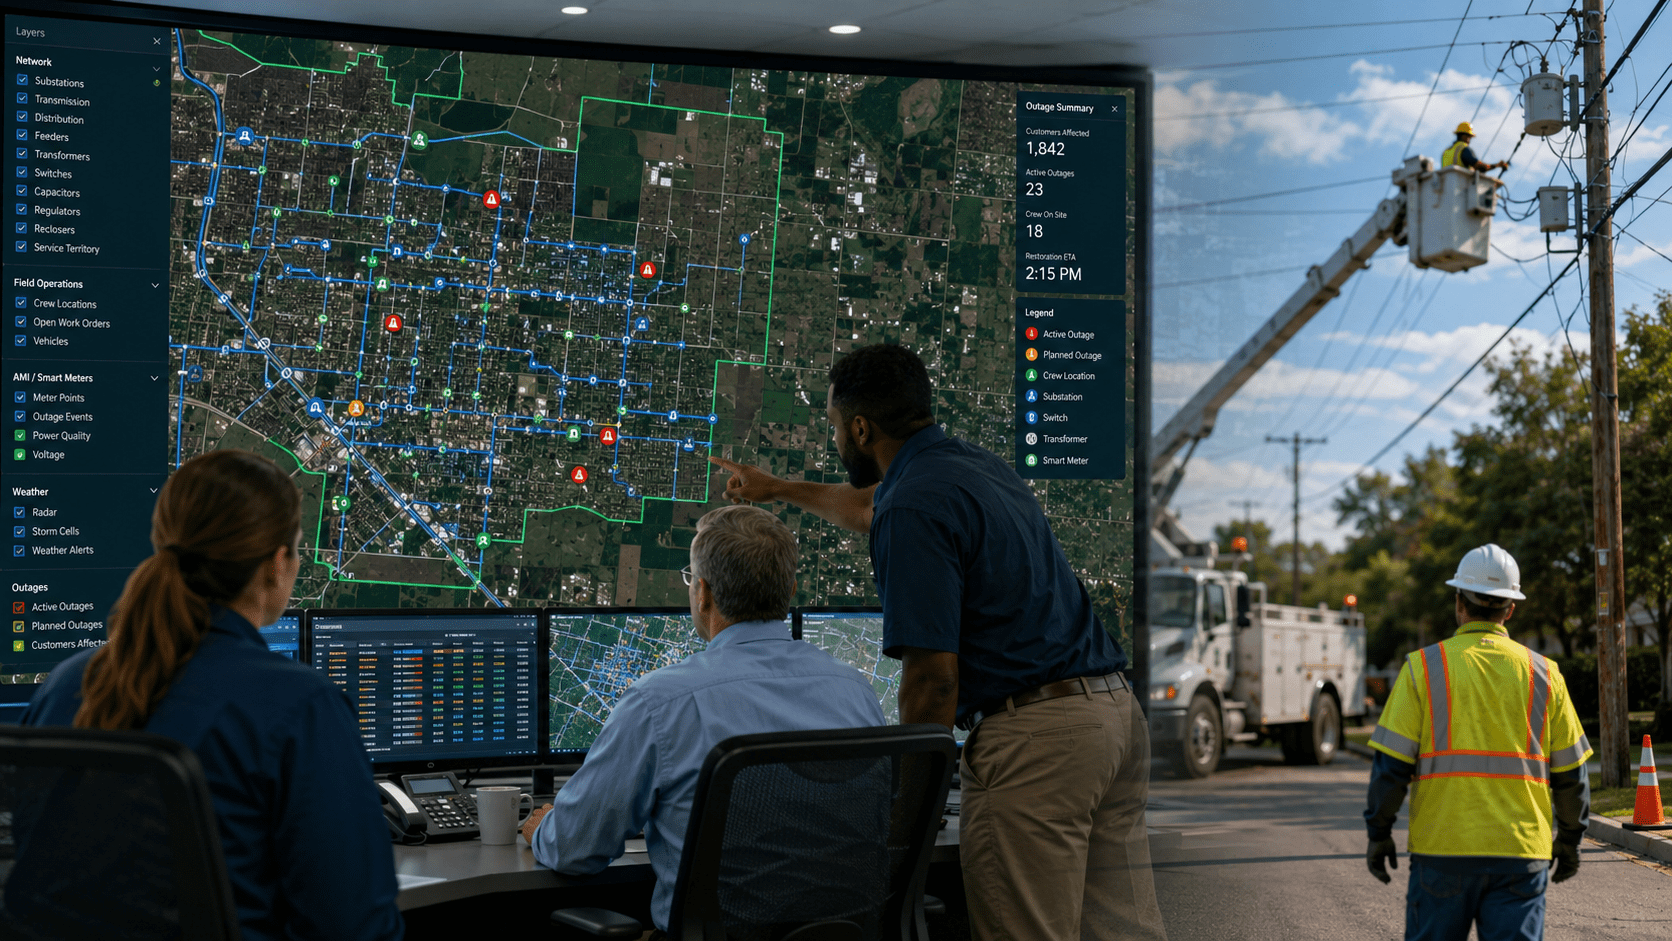
What GIS for Electric Utilities Actually Covers
Geographic Information Systems (GIS) for the electric sector is the combination of spatial data, network connectivity rules and software used to capture, manage, analyse and act on the physical electric network. It sits underneath, and increasingly feeds directly into, an electric utility’s other core systems.
In practice, electric utility GIS covers a wide scope: modelling substations, feeders, transformers, poles, switches and service points with their electrical connectivity intact; supporting outage management and restoration through network tracing; managing vegetation risk near conductors using LiDAR and imagery; mapping Advanced Metering Infrastructure (AMI) and integrating meter data with the network; supporting load and capacity planning for renewables and EV charging; and feeding digital twin platforms with a continuously updated spatial foundation. RedPlanet Solutions delivers each of these through GE Vernova Smallworld Electric Office, Esri’s Utility Network, and supporting open-source tools where appropriate.
It is worth being precise about scope, because GIS for electric utilities is frequently confused with general asset mapping. A simple point map of poles is mapping. A model that knows which poles feed which transformers, and which transformers feed which customers, and can trace that chain instantly during an outage, is a utility network. The difference is not cosmetic. It is the entire reason connectivity-aware GIS exists.
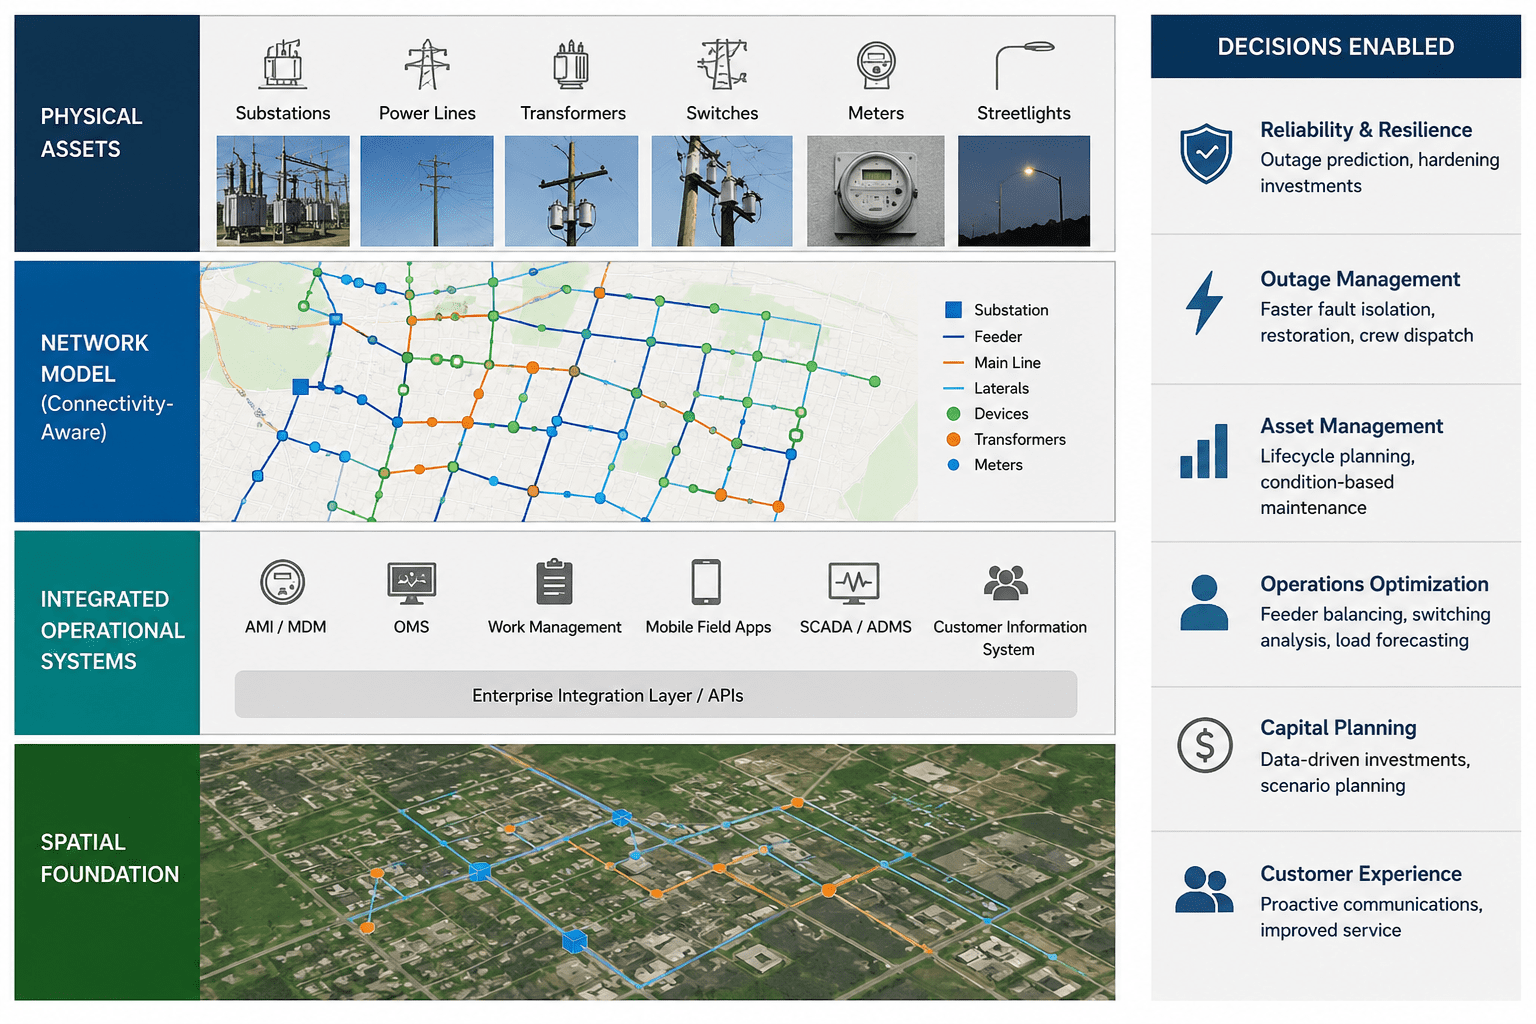
The Utility Network Model: The Part Most Buyers Underestimate
The single most consequential technical decision in any electric utility GIS programme is the choice and quality of the underlying network model. This is the layer that separates a usable system from an expensive, static archive.
A connectivity-aware utility network model treats every asset as a node or edge in a graph, not just a shape on a map. Each transformer, switch and conductor segment carries electrical attributes, voltage class, phase, status, that allow the system to answer operational questions instantly: what happens downstream if this breaker opens, which customers sit on this feeder, and whether a proposed new connection exceeds the remaining capacity on this transformer. Esri’s Utility Network and GE Vernova Smallworld Electric Office are the two platforms most commonly used to deliver this in 2026, and both are built around the same underlying principle even though their data models differ.
A common and costly mistake is migrating legacy asset data into a new GIS platform without rebuilding the connectivity rules properly. The map will look correct. The network will not behave correctly. Tracing, schematic generation and outage propagation all depend on connectivity being modelled, not just geometry being copied across.
Why Connectivity Changes Everything Operationally
Once a network model can trace connectivity, an entire set of operational workflows becomes possible that a static map cannot support. Crews can be shown exactly which customers are affected by a fault before they arrive on site. Planners can query feeder headroom at any point on the network before approving a new solar interconnection. Vegetation teams can rank spans by both proximity to conductors and the number of customers that span would affect if it failed. None of this is map-reading. It is network reasoning, and it depends entirely on the underlying model being built correctly from the outset.
Six Core GIS Applications for Electric Utilities
Most utilities start with one or two of these applications and expand over time. The strongest programmes treat all six as part of one connected system rather than six separate projects, because the underlying network model is shared across every one of them.
Network Asset Management
A single, connected record of substations, feeders, transformers, poles and switches with up-to-date condition data.
Outage Management
Tracing customer service points to upstream assets so faults are located and restored faster.
Vegetation Risk Management
LiDAR and drone imagery measuring conductor clearance and ranking trim priority by risk.
AMI and Meter Integration
Connecting smart meter data to the network model for accurate phase, voltage and outage detection.
Load and Capacity Planning
Assessing feeder and transformer headroom for renewables, storage and EV charging connections.
Digital Twin and Grid Intelligence
A continuously updated spatial model feeding simulation, monitoring and AI-assisted decisions.
1. Network Asset Management
This is the foundation layer. Every substation, feeder, transformer, pole, switch and conductor segment needs a verified location, a connectivity relationship to its neighbours, and a condition record that field teams trust. Without this, every other application listed here inherits the same gaps and errors.
2. Outage Management
When a fault occurs, the speed of restoration depends almost entirely on how quickly the system can answer two questions: which customers are affected, and where is the fault most likely located. A GIS-backed outage management system (OMS) answers both by tracing the connected network from the reported outage point upstream, rather than relying on call volume guesswork.
3. Vegetation Risk Management
Vegetation contact with conductors remains one of the leading causes of outages, and in wildfire-prone regions, a serious safety risk. GIS combines LiDAR point clouds and high-resolution drone or satellite imagery with the network model to measure clearance against every span, then ranks trimming priority by both proximity and the number of customers a failure would affect, which is far more useful than ranking by vegetation density alone.
4. AMI and Meter Integration
Advanced Metering Infrastructure generates enormous volumes of interval data, but that data is only as useful as its connection to the network model. Mapping meters correctly to phase, transformer and feeder allows utilities to detect outages from meter pings, validate phase balance and identify non-technical losses with far greater confidence than manual reconciliation ever could.
5. Load and Capacity Planning
As rooftop solar, battery storage and EV charging infrastructure expand, planners need to know, at any specific point on the network, how much additional load or generation a feeder or transformer can absorb. A properly connected GIS network model can answer that query directly, turning interconnection requests from a manual engineering exercise into a much faster, evidence-based decision.
6. Digital Twin and Grid Intelligence
The most advanced electric utilities now treat their GIS network model as the spatial foundation for a digital twin, a continuously updated representation that combines SCADA, AMI and sensor data with the physical network to support simulation, monitoring and increasingly, AI-assisted anomaly detection. This is covered further in the trends section below.
Not sure whether your current network model can support outage tracing or load planning properly? Our team can assess your existing GIS data before you commit budget to a platform change.
Talk To Our ConsultantsWhere Does Your Network Sit Today?
Electric utilities vary enormously in GIS maturity, often within the same country and even within the same organisation across legacy and newer service territories. Identifying your current level matters because it determines what the next sensible investment actually is, rather than what looks impressive in a vendor presentation.
Most distribution utilities across Southeast Asia and South Asia sit at Level 2-3. Most large investor-owned utilities in North America and Australia sit at Level 3-4.
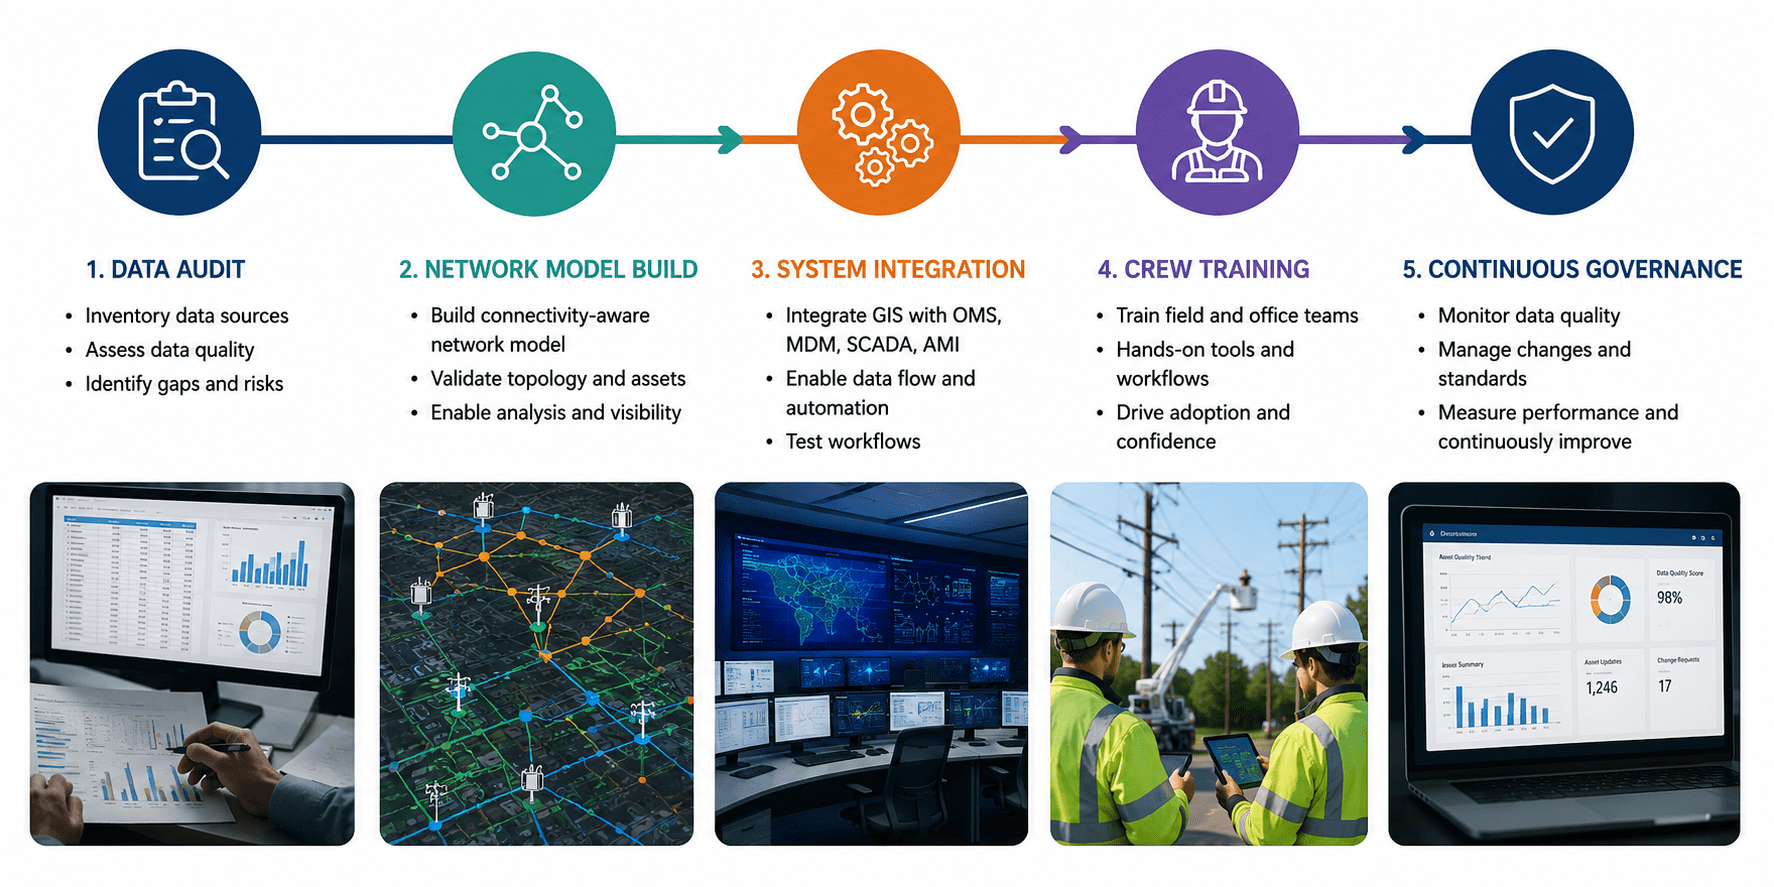
Choosing the Right Platform for Your Network
There is no single correct GIS platform for electric utilities. The right choice depends on network size, existing enterprise systems, in-house GIS skills and long-term support requirements. Use this guide to match your situation to the most sensible starting point.
Large distribution network with no connectivity-aware model yet
Full utility network model build on Esri Utility Network or GE Vernova Smallworld Electric Office, with a phased migration plan
Existing Esri or Smallworld deployment that needs data quality remediation
Targeted data quality audit and migration support rather than a full platform replacement
Need transmission corridor or substation surveying before any modelling work
Drone surveying and LiDAR capture to establish an accurate baseline before the network model is built
Rapid growth in EV charging or solar interconnection requests
Load and capacity planning module built on top of the existing network model, prioritised ahead of cosmetic upgrades
Budget-sensitive distribution co-operative or municipal utility
Open-source stack using QGIS, PostGIS and GeoServer, scoped against the same connectivity requirements as a commercial platform
When RedPlanet Solutions Is a Strong Fit
RedPlanet Solutions is a strong fit when an electric utility needs its network model to do more than display assets, when outage response, capacity planning or vegetation risk depend on the data being genuinely connected and current.
Network model build and migration
For utilities moving from static asset mapping to a connectivity-aware model on Esri or GE Vernova Smallworld Electric Office.
Drone surveying and LiDAR for transmission and substations
For establishing an accurate, current baseline before any data migration or modelling work begins.
Data migration and quality assurance
For utilities with existing GIS investments that need genuine connectivity restored, not just a platform upgrade.
Digital twin and grid intelligence foundations
For utilities preparing their spatial data to support SCADA, AMI and AI-assisted grid monitoring.
If you only need a one-off asset survey with no ongoing data governance need, a smaller surveying contractor may suffice. If outage response time, interconnection decisions or long-term grid planning depend on the data, a consulting partner with utility network expertise is the safer choice.
Three Rules That Will Protect Your Network Model
Across electric utility GIS programmes of every size, three principles reliably separate network models that hold up operationally from ones that quietly degrade into unreliable archives.
“A correct-looking map with broken connectivity is more dangerous than an obviously outdated one.”
An outdated map prompts caution. A polished map with silent tracing errors prompts false confidence, in outage response, in capacity approvals, in safety planning. Validate that traces, schematics and electrical rules behave correctly before trusting any migrated dataset, regardless of how clean it looks visually.
“If field updates do not flow back into the network model within hours, the model will drift from reality within weeks.”
Electric networks change constantly through repairs, reconfigurations and new connections. A GIS that depends on periodic manual updates will always lag behind the physical network. Build the field-to-office update loop into the workflow from day one, not as a later enhancement.
“GIS that does not talk to OMS, SCADA and AMI is a more expensive way of maintaining a separate spreadsheet.”
The value of a connectivity-aware network model compounds only when it is genuinely integrated with the systems that operate the grid day to day. Treat integration scope as core to the GIS programme, not as a future phase that gets deprioritised when budgets tighten.
What Changed Between 2020 and 2026
Buyers applying 2020-era expectations to electric utility GIS in 2026 are underestimating both the opportunity and the risk. Five developments have reshaped what a serious implementation now looks like.
Geometric Networks Were Still the Norm
Most utility GIS deployments still ran on older geometric network models with limited electrical attribution. Outage tracing was approximate, and capacity queries were largely manual engineering exercises.
Connectivity-Aware Models Reach Maturity
Esri’s Utility Network and GE Vernova Smallworld Electric Office matured into reliable, widely deployed platforms, shifting the industry conversation from “can this model trace correctly” to “how fast can we migrate to it”.
EV and Distributed Energy Load Becomes a Planning Priority
Rising EV charging infrastructure and rooftop solar interconnection requests pushed feeder and transformer hosting capacity analysis from a specialist task into a routine GIS query that planning teams expect on demand.
Wildfire and Climate Risk Tighten Vegetation Standards
Regulatory scrutiny in wildfire-prone regions intensified, and utilities increasingly combined LiDAR-derived vegetation clearance data with network-aware risk scoring rather than treating vegetation management as a separate workstream from grid reliability.
Digital Twins and AI-Assisted Grid Intelligence Become Mainstream
Utilities increasingly feed their connectivity-aware GIS into digital twin platforms that combine SCADA, AMI and sensor data, with AI-assisted anomaly detection and predictive maintenance now appearing in production deployments rather than pilots.
Technology Trends Every Utility Buyer Should Understand
GeoAI for Asset Inspection
AI-assisted feature extraction from drone and satellite imagery is now commercially deployable for electric utilities, identifying damaged poles, leaning structures, vegetation encroachment and even thermal anomalies on equipment from aerial imagery at a scale manual inspection cannot match. GeoAI-driven asset inspection works best when the detected features are written directly back into the connected network model, rather than sitting in a separate imagery review tool.
When evaluating a vendor’s GeoAI claims, ask for evidence from deployed transmission or distribution projects, not general AI capability statements, and confirm how detected anomalies flow into the existing asset and work management systems.
Real-Time SCADA and ADMS Integration
Advanced Distribution Management Systems (ADMS) increasingly expect a live, queryable network model rather than a periodically refreshed extract. This means the GIS network model and the operational systems used by control room staff need to share a common, continuously synchronised view of network state, switch positions and load.
Digital Twins for Grid Operations
Digital twins for electric utilities combine the spatial network model with real-time SCADA, AMI and sensor feeds to create a continuously updated representation of grid state. RedPlanet Solutions builds the spatial foundation that makes this possible, since a digital twin is only as reliable as the network connectivity it is built on. Treat digital twin capability as a distinct engineering discipline on top of the core GIS, not an automatic feature of any platform purchase.
The Real Cost of Getting This Wrong
Electric utility GIS failures rarely show up immediately. They surface during the first major storm, the first contested outage restoration time, or the first solar interconnection dispute. Understanding the full exposure helps justify proper investment upfront.
| What Goes Wrong | The Downstream Cost | Risk Level |
|---|---|---|
| Broken connectivity after migration | Outage tracing returns wrong or incomplete affected-customer lists, slowing restoration and increasing customer complaints and regulatory exposure. | High |
| Stale vegetation risk data | Trimming budgets get allocated by guesswork rather than verified clearance, raising both outage frequency and, in high-risk regions, wildfire liability. | High |
| Inaccurate hosting capacity data | Solar and EV interconnection approvals either stall unnecessarily or proceed without proper headroom checks, risking equipment overload. | High |
| Disconnected AMI and network model | Outage detection from meter data becomes unreliable, and non-technical loss investigation loses its primary evidence base. | Medium |
| Field-to-office update lag | The network model drifts from physical reality, eroding trust in the system and pushing teams back toward informal, undocumented knowledge. | Medium |
| Vendor lock-in on data format | Future platform changes or digital twin integration become significantly more expensive when network data cannot be exported cleanly. | Medium |
RedPlanet Solutions offers an initial network data assessment to help you understand exactly where your current GIS stands before committing to a platform change.
Book a Free Consultation“A network model is only as useful as the connectivity it represents. Location without connection tells you where something is. Connection tells you what happens next, and that is the question every utility actually needs answered.”RedPlanet Solutions, on the role of connectivity-aware GIS in electric utility operations
The Five Most Costly Implementation Mistakes
Migrating geometry without rebuilding connectivity
It is common, and tempting, to migrate legacy GIS data into a new platform by mapping shapes across without properly rebuilding the electrical connectivity rules behind them. The result looks correct and traces incorrectly, which is far more dangerous than an obviously outdated system.
Treating GIS as a one-off project rather than ongoing governance
A network model is only accurate on the day it is delivered unless field updates, new connections and decommissioning are captured continuously. Budget for ongoing data governance from the start, not as a future line item.
Scoping vegetation management separately from network risk
Vegetation clearance data is far more useful when it is scored against the number of customers a given span would affect if it failed, not just measured in isolation. Integrate vegetation risk scoring with the network model rather than running it as a parallel system.
Deferring OMS, ADMS and AMI integration to a later phase
A connectivity-aware network model that is not integrated with the systems controlling daily operations delivers a fraction of its potential value. Integration scope should be defined alongside the network model build, not bolted on afterwards.
Choosing a platform before assessing existing data quality
Platform selection debates often happen before anyone has properly audited the quality of the existing network data. A platform change cannot fix bad data; it can only make the consequences of bad data more visible, more quickly.
Comparing Electric Utility GIS Platforms
| Platform | Best For | Strengths | Watch For |
|---|---|---|---|
| Esri Utility Network | Utilities standardised on the broader Esri ecosystem; North American and Australian deployments | Deep ArcGIS integration; large implementation partner network | Migration from legacy geometric networks requires careful planning |
| GE Vernova Smallworld Electric Office | Distribution and transmission operators with long-standing Smallworld deployments, common across Europe and Asia-Pacific | Strong network connectivity model; proven at large utility scale | Specialist skills required for configuration and upgrades |
| Hexagon Geospatial | Utilities needing strong network and asset lifecycle integration | Solid asset management and network analysis tooling | Smaller implementation partner ecosystem in some regions |
| Open-source stack (QGIS, PostGIS, GeoServer) | Budget-conscious distribution co-operatives and municipal utilities | No licensing cost; full control over the data model | Requires in-house or contracted expertise to build connectivity rules properly |
| SuperMap | Utilities needing strong 3D and big-data GIS capability | Cross-platform deployment; solid AI-GIS tooling | Smaller installed base among Western electric utilities |
What’s Coming Next
The following represent analytical observations on market direction as of June 2026, not guaranteed outcomes.
Hosting capacity queries become a self-service tool for planners
As EV and distributed energy interconnection requests keep rising, expect more utilities to expose feeder and transformer hosting capacity as a direct, self-service GIS query for planning teams rather than a manual engineering study for every request.
AI-assisted vegetation risk scoring becomes standard practice
Combining LiDAR clearance data with network-aware customer impact scoring will increasingly become the expected standard for vegetation management, particularly across wildfire-exposed regions.
Digital twin pilots convert into operational tools through 2028
Utilities that have invested in connectivity-aware network models are well positioned to convert digital twin pilots into genuinely operational tools, while those still on static asset maps will need to complete the network model work first.
Regulatory reporting increasingly draws directly from GIS
Reliability metrics, vegetation compliance reporting and interconnection timelines are increasingly expected to be generated directly from the network model rather than reconciled manually after the fact.
The skills gap in connectivity-aware GIS widens
Demand for staff who understand both electrical network behaviour and modern GIS platforms continues to outpace supply, making experienced implementation partners more valuable, not less, as the technology matures.
Electric Utility GIS Implementation Checklist
18 checks across three phases. Complete all before committing budget to a platform change or migration.
Frequently Asked Questions
What is GIS for electric utilities?
Why do electric utilities need GIS?
What is a utility network model in GIS?
How does GIS help with outage management?
What is the difference between Esri and GE Vernova Smallworld for electric utilities?
How does GIS support vegetation management for electric utilities?
Can GIS handle EV charging load and distributed energy resources?
What is a digital twin for an electric utility?
How long does it take to implement GIS for an electric utility?
Does GIS for electric utilities also apply to gas, water and telecom networks?
A Connected Network Model Is the Real Deliverable
GIS for electric utilities in 2026 is no longer a question of whether to digitise the network. Nearly every utility has some form of digital record already. The real question is whether that record can be trusted to trace correctly, integrate with operational systems and support the next decade of grid change driven by renewables, electrification and climate risk.
The utilities that get this right treat the network model as a living asset, with connectivity validated, field updates flowing back continuously, and integration with OMS, ADMS and AMI built in from the start rather than bolted on later. The utilities that get it wrong discover the gaps during a storm, a contested interconnection decision or a regulatory audit, when the cost of fixing the model is far higher than the cost of building it properly the first time.
Use the maturity framework to understand where your network currently sits. Apply the three rules as a screening filter for any vendor or platform decision. And treat data governance as a permanent operational discipline rather than a one-off project milestone.
If you manage an electric network of any size, the question worth asking before any platform conversation is simple: can your current GIS trace an outage correctly right now, without a workaround? If the honest answer is no, that is where the next investment should go.
Ready to Talk?
RedPlanet Solutions delivers GIS for electric utilities through GE Vernova Smallworld Electric Office and Esri’s Utility Network, with operations in Malaysia, India and Australia, and two decades of project experience across grid modernisation, outage management and network data quality.
Talk To Our GIS Consultants
PK Senthilkumar is CEO of RedPlanet Solutions and the author of this guide. His work focuses on GIS consulting, electric utility network modelling, grid modernisation, data quality and practical spatial decision-making for organisations operating across Malaysia, India, Australia and international markets.
About RedPlanet Solutions
RedPlanet Solutions (M) Sdn Bhd is a Malaysia-based GIS consulting and geospatial services company. The company delivers GIS for electric utilities, gas, water and telecommunications network operators, alongside drone surveying, data migration and GIS software development across Southeast Asia, the Middle East, Australia and beyond. RedPlanet works across leading commercial and open-source GIS ecosystems, including GE Vernova Smallworld, Esri, Hexagon Geospatial, SuperMap, QGIS, GeoServer and related enterprise geospatial technologies.