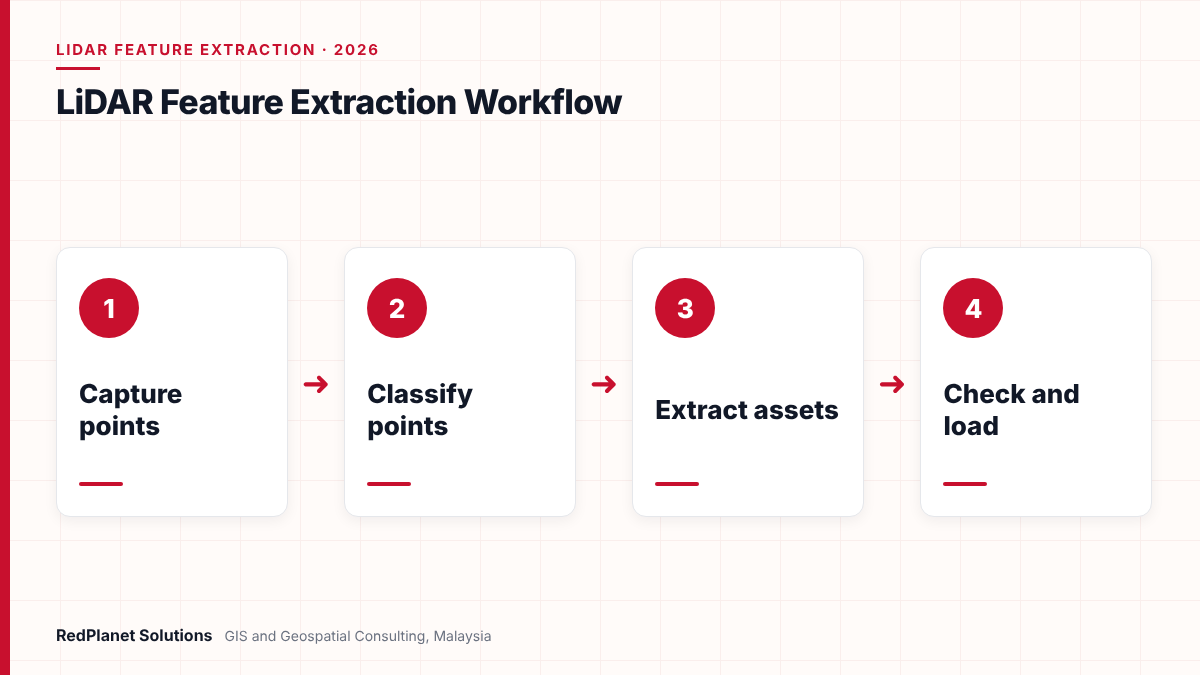
LiDAR feature extraction turns point clouds and imagery into GIS features, such as poles, conductors, towers, buildings and kerbs. First, software classifies each point. Next, automated rules or AI models pick out assets. Then analysts check the results and add attributes. Finally, the team proves accuracy against survey checkpoints and loads the features into the utility GIS.
- LiDAR feature extraction turns raw points and photos into GIS assets with geometry and attributes.
- The ASPRS LAS format gives standard class codes for ground, buildings, wires and towers, so classification has a shared language.
- AI models, such as the Esri power line model, speed up the work, but people still need to check and fix the output.
- Under the ASPRS Positional Accuracy Standards, Edition 2, a fully compliant accuracy test needs at least 30 checkpoints.
- Cost depends most on area, point density, the number of feature types, the attribute detail and the QA level you set.
What is LiDAR feature extraction for utilities?
LiDAR feature extraction is the work of turning a point cloud into real GIS features. For a utility, that means poles, wires, towers, cabinets, kerbs and nearby trees, each with a shape and attributes.
A LiDAR sensor fires laser pulses and records where each one hits. As a result, a single survey can hold billions of points. But a point cloud on its own is not an asset register. So someone, or some software, must decide which points form a pole and which form a tree. Then the team must draw the pole as a GIS feature and fill in its fields.
Most projects also use photos taken at the same time as the scan. For example, a mobile mapping van often carries both a laser scanner and cameras. In that case, the photos help staff read pole tags, check materials and confirm what the points show. Our data extraction services page explains how we turn both sources into GIS layers.
Which data sources feed LiDAR feature extraction?
Three main sources feed the work: mobile mapping, aerial LiDAR and drone LiDAR. Each one sees assets from a different angle, so the best choice depends on the features you need.
Mobile mapping
A vehicle scans streets from the side, so it sees poles, cabinets, kerbs and signs in fine detail.
Aerial LiDAR
A plane covers large areas fast, so it suits corridors, terrain models and wide tree surveys.
Drone LiDAR
A drone flies low over sites and short routes, so it gives dense data where roads do not reach.
Imagery
Photos add colour, text and context, so staff can read tags and confirm asset types.
Point density matters too. For instance, the USGS 3D Elevation Program sets quality levels for its elevation data. Its QL2 level asks for at least 2 pulses per square metre, while QL1 and QL0 ask for at least 8. However, those levels target terrain mapping across a country. In contrast, asset work on thin wires and street furniture often needs far denser data.
| Level | Pulse density | Vertical RMSEz |
|---|---|---|
| QL0 | 8 or more per m². | 5 cm. |
| QL1 | 8 or more per m². | 10 cm. |
| QL2 | 2 or more per m². | 10 cm. |
In Malaysia, the national grid company already uses drone LiDAR in the field. In fact, RIEGL reported in 2024 that Tenaga Nasional Berhad bought VUX-120 UAV LiDAR sensors to help plan new transmission routes through forest reserves. So local teams now hold more point cloud data than ever. Our guide to mobile mapping for utility asset surveys covers how to plan that capture.
How does point cloud classification work?
Classification gives every point a class code, such as ground, building or wire. Also, it comes first, because later steps only work well on sorted points.
ASPRS created and maintains the LAS format, the common file type for LiDAR data. In addition, it sets standard class codes. According to Esri’s LAS documentation, these codes include several classes that matter to utilities.
| Code | Class | Utility use |
|---|---|---|
| 2 | Ground. | Terrain and clearance base. |
| 6 | Building. | Footprints and service points. |
| 14 | Wire, conductor (phase). | Overhead lines. |
| 15 | Transmission tower. | Towers and large poles. |
| 16 | Wire-structure connector. | Insulators. |
| 17 | Bridge deck. | Crossings. |
First, software finds the ground. Then it sorts the rest by height above ground, shape and return type. For example, points high above the ground in a thin line are likely wires. But branches near a line can look the same. So analysts still review hard spots, such as dense trees and busy junctions.
In our experience, good classification saves more time than any other step. If the classes are right, extraction is fast. If they are wrong, every later step pays for it.RedPlanet Solutions
How do automated and AI methods extract utility features?
Automated methods use rules or trained models to find assets in classified points. Today, deep learning does much of the heavy work, but people still guide and check it.
First, rule-based tools look for set patterns. For instance, a rule might flag a tall, thin, upright cluster as a pole. In contrast, AI models learn from labelled samples. Esri offers a Power Line Classification pretrained model built on RandLA-Net. So it labels distribution wires as class 14 and poles as class 15. However, Esri notes that it is less consistent for high-tension transmission wires.
What does a typical AI workflow look like?
- Prepare the data: classify ground and build height models first.
- Label sample areas, either by hand or with a starter model.
- Train a model, or fine-tune a pretrained one, on your own data.
- Classify the full point cloud with the chosen model.
- Fix errors, then build 3D lines and other features from the classes.
Esri’s ArcGIS Pro workflow follows this pattern. In particular, it then uses an Extract Power Lines From Point Cloud tool to build 3D lines. Next, a Generate Clearance Surface tool maps the zone around them. Also, FME can split point clouds by class with its PointCloudFilter, so teams can feed each class into its own process. Our article on AI pole detection shows one use of this approach.
You need only a few feature types over a small area.
Use rules and manual digitising, because training a model may cost more than it saves.
You have large areas with the same asset types.
Fine-tune an AI model on local samples, then run it at scale.
Your assets look unusual or the data is sparse.
Mix automation with manual work, and plan more review time.
How do you check the quality of extracted features?
Quality checks prove that every asset is present, correct and in the right place. So plan them before extraction starts, not after delivery.
Good QA covers four things. First, it checks completeness, so no pole or span goes missing. Next, it checks attributes, such as material, height and asset ID. Then it checks geometry and links, since a wire must end at a pole. Finally, it checks position against survey points. Our GIS data QA/QC checklist for utilities gives a fuller set of tests.
LiDAR extraction QA checklist
Run these checks on every delivery batch.
No data spec
If you skip a clear spec, each analyst draws features in a different way.
Checks at the end only
Late checks find errors when fixing them costs most, so check each batch.
Trusting AI output blindly
Models miss assets in hard spots, so always review a sample.
Ignoring the target model
Features must fit your GIS schema, or the load will fail.
In addition, an independent check helps. That is because the team that built the data may miss its own errors. Our GIS QA/QC services can act as that second pair of eyes.
What accuracy can LiDAR feature extraction achieve?
Accuracy depends on the sensor, the trajectory, ground control and point density. So the honest answer is to set a target in the contract and then prove it with checkpoints.
The ASPRS Positional Accuracy Standards, Edition 2 give a common way to do this. The ASPRS board approved it in August 2023. It now uses RMSE as the single accuracy measure and drops the 95 percent confidence figure. In addition, it counts the error in the survey checkpoints themselves.
Also, keep two types of accuracy apart. First, absolute accuracy shows how close a feature sits to its true place on the earth. Next, relative accuracy shows how well features line up with each other. For example, a sag check on a wire needs good relative accuracy. But a link to land parcels needs good absolute accuracy as well.
What outputs should a utility ask for?
So ask for outputs that load straight into your GIS and work tools. A good delivery holds features, the classified points and a clear QA report.
GIS features
For example, poles, spans, towers and other assets, built to your schema and data model.
Classified point cloud
LAS or LAZ files with standard class codes, so you can reuse them later.
Terrain and surface models
Also, ground and surface rasters for clearance checks and design work.
Clearance reports
For instance, lists of trees or structures close to lines, ranked by risk.
QA and accuracy report
In addition, checkpoint results, error counts and a clear pass or fail record.
Next, agree the target platform early. For example, features for GE Vernova Smallworld need a different structure from those for an ArcGIS utility network. So match the output to your network model, not to the tool that made it. Our guide to GIS for electric, water, gas and telecom utilities explains how each sector uses these layers.
Have point clouds or imagery that you need to turn into GIS assets? Our team can review your data and your target model.
Talk To Our Consultants →What drives the cost of LiDAR feature extraction?
Cost depends mainly on how much area you cover, how many feature types you need and how much detail each one carries. QA level and the target format then add to the total.
| Driver | Why it matters |
|---|---|
| Area or route length. | More ground means more points to process. |
| Point density. | Dense data shows more detail but takes longer. |
| Feature types. | Each new type needs its own rules or model. |
| Attributes. | Reading tags from photos is slow manual work. |
| QA level. | Full checks cost more than sample checks. |
| Target model. | Complex schemas need more mapping and tests. |
Start with a pilot
Run a small area first, so you can test the spec, the tools and the true effort.
Ask only for what you use
Every extra field adds time, so pick the attributes that daily work needs.
Reuse the point cloud
Keep classified points, because new projects can draw on them later.
LiDAR feature extraction is not always the cheapest route. For instance, a small network with good records may only need a field check. Also, LiDAR cannot see buried pipes or cables. So for underground assets, plan other survey methods.
Frequently Asked Questions
What is LiDAR feature extraction?
LiDAR feature extraction is the process of turning a point cloud into GIS features with shapes and attributes. For a utility, those features include poles, wires, towers, cabinets and nearby trees. First, software classifies the points. Then rules, AI models or analysts pick out each asset. Finally, the team checks the results and loads them into the GIS.
What is the difference between classification and feature extraction?
Classification gives each point a class code, such as ground, building or wire. Feature extraction then turns groups of classified points into GIS objects. For example, it turns wire points into a 3D line and pole points into a point feature with a height. So classification sorts the points, while extraction builds the assets.
Can AI fully automate LiDAR feature extraction?
Not yet. AI models now handle much of the work, such as finding wires and poles. However, they still miss assets in dense trees or busy streets. Esri, for example, says its power line model is less consistent for high-tension transmission wires. So plan for human review and fixes on every project.
How many checkpoints do I need to test accuracy?
Under the ASPRS Positional Accuracy Standards, Edition 2, a fully compliant accuracy test needs at least 30 checkpoints. The earlier edition asked for 20. Also, Edition 2 reports accuracy as RMSE only, and it counts the error in the checkpoints themselves. So agree the checkpoint plan before the survey starts.
What file formats come out of a LiDAR extraction project?
Most projects deliver classified point clouds in LAS or LAZ format, plus GIS features in the format your platform uses. In addition, many include terrain rasters, clearance reports and a QA report. Our data extraction team can match the outputs to your GIS schema.
Can LiDAR find underground utility assets?
No. LiDAR only measures surfaces that the laser can reach, so it cannot see buried pipes or cables. However, it can capture surface signs of them, such as manhole covers, valve boxes and kerb markers. For the assets below ground, use other methods, such as ground-penetrating radar or records research, alongside the LiDAR data.
How should a utility plan LiDAR feature extraction?
A sound LiDAR feature extraction project starts with a clear goal and a clear data spec. First, decide which assets and fields your teams really need. Next, pick a capture method and point density that fit those assets.
Then classify the points with standard codes and use automation where it pays off. After that, check every batch and prove accuracy with enough checkpoints. Finally, load the features into your GIS model. As a result, your planners, field crews and asset teams get data they can trust. For help with any step, get in touch with our team.

Turn Your Point Clouds Into Trusted Utility GIS Assets
RedPlanet Solutions classifies LiDAR data, extracts utility features with automated and AI methods, checks quality and loads the results into your GIS. Talk to us about your next extraction project.
Talk To Our GIS Consultants
PK Senthilkumar is CEO of RedPlanet Solutions. His work focuses on GIS consulting, network-based GIS for utilities, enterprise GIS modernisation and practical spatial decision-making for organisations operating across Malaysia, India, Australia and international markets.
About RedPlanet Solutions
RedPlanet Solutions (M) Sdn Bhd is a Malaysia-based GIS consulting and geospatial services company and part of RedPlanet Berhad. The company delivers GIS for electric utilities, spatial data collection, drone surveying, mobile mapping and GIS software development to utilities, government agencies, smart cities and private sector organisations across Southeast Asia, the Middle East, Australia and beyond. RedPlanet works across leading commercial and open-source GIS ecosystems, including GE Vernova Smallworld, Esri, Hexagon, SuperMap, QGIS, GeoServer and FME.