
GIS for utilities is a connected digital model of a network, such as power lines, water mains, gas pipes or fibre cables. It records where each asset sits and how it connects. As a result, teams can trace faults, plan work and share one source of truth with outage, SCADA, ERP and customer systems.
- A utility GIS records both where assets are and how they connect, so it can answer network questions, not just map ones.
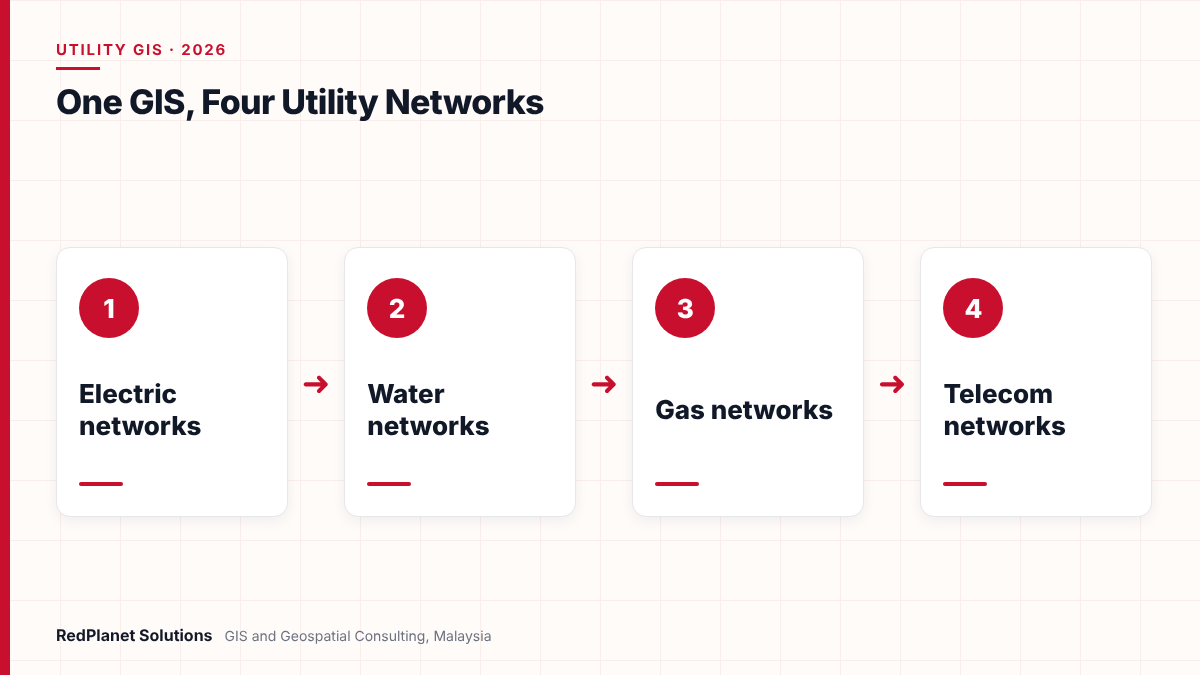
- Electric, water, gas and telecom networks share the same core needs, but each one adds its own rules and analysis.
- A shared data model with common structures, IDs and quality rules lets one GIS serve several networks.
- The GIS earns its value through links to OMS, SCADA, ERP and CRM, so plan those links from the start.
- Choose a platform by network fit, link needs, skills and total cost, not by brand alone.
What is GIS for utilities?
GIS for utilities is a geographic information system built to model a utility network. It stores each asset, its place on the ground and its links to other assets. So it works as a live record of the network, not just a map.
A plain map shows where a pipe or cable runs. However, a utility GIS also knows what feeds it, what it feeds and which valve or switch can isolate it. That is why utilities call it a network model. In turn, this connected model lets teams trace flows, find affected customers and plan new work with confidence.
Most utilities use the GIS across the whole asset life cycle. For example, planners design new links in it, field crews check records on mobile devices and control room staff use it during faults. Our GIS consulting services cover each of these stages for electric, water, gas and telecom firms.
Location
Every asset has an accurate place, so crews can find it and planners can design around it.
Connectivity
Assets link in the right order, so the system can trace flow from source to customer.
Attributes
Each asset carries its size, material, age and status, so analysis and reports stay correct.
How do electric utilities use GIS?
Electric utilities use GIS to model lines, cables, transformers, switches and customer connections from the substation to the meter. Then they use that model to manage outages, plan load and connect new customers.
In an electric network, switch states matter a great deal. For instance, one open switch changes which customers a feeder supplies. So the GIS must track normal and current states and pass them to outage and distribution systems. In addition, the rise of rooftop solar, batteries and EV chargers means the model must now hold far more assets at the low voltage edge.
- Outage support: if a device fails, trace which customers sit behind it.
- Network planning: check loads first, then find room for new connections.
- Asset care: record poles, cables and transformers so crews can plan maintenance.
- New connections: also design the service path from the nearest transformer.
Because electric GIS is a large topic, we cover it in full in our complete guide to GIS for electric utilities. You can also see our electric utility GIS services.
How do water utilities use GIS?
Water utilities use GIS to model mains, valves, hydrants, meters and pump stations. In particular, the main goals are to cut water loss, isolate bursts quickly and plan pipe renewal.
Water loss is a pressing issue, because every lost litre costs money. For example, Malaysia’s National Water Services Commission (SPAN) put national non-revenue water at 37.1 percent in 2023, as reported by the New Straits Times. Also, the government aims to bring it down to 28.8 percent by 2030. Therefore, water operators need accurate records of every main and meter.
District metered areas
GIS defines each metered zone, so teams can compare flow in and use out to find losses.
Valve isolation
A valve trace shows which valves to shut for a burst and which customers lose supply.
Pipe renewal
Pipe age, material and burst history help rank which mains to replace first, so budgets go further.
Sewer and drainage
Many water firms also model sewers and drains in the same GIS for a fuller view.
Next, water models often feed hydraulic tools for pressure and flow studies. So the GIS must keep pipe sizes, levels and links clean. Learn more on our water utility GIS page.
How do gas utilities use GIS?
Gas utilities use GIS to model pipes, regulators, valves, service lines and pressure zones. Above all, they use it for safety, because staff must know where every pipe runs and how to isolate it.
First, a gas GIS splits the network into pressure systems, from high pressure lines to low pressure service pipes. Then a trace can show which valves cut off a section and which customers it affects. Also, the GIS supports leak surveys, pipe inspection records and work near third party digs.
| Task | Data needed |
|---|---|
| Emergency isolation. | Valves and links, since crews must act fast. |
| Leak survey planning. | Pipe material, age and survey history. |
| Third party dig checks. | Accurate pipe routes, because digs can hit pipes. |
| Corrosion care. | Cathodic protection points and readings. |
In Malaysia, the Energy Commission (Suruhanjaya Tenaga) regulates the electricity supply and piped gas industries in Peninsular Malaysia and Labuan. So gas firms need records they can rely on for licensing, safety and audits. See our gas utility GIS services for more.
How do telecom operators use GIS?
Telecom operators use GIS to model ducts, poles, cables, fibres, splice points and equipment. Unlike a pipe network, a fibre network also needs records of each circuit and port, so the model goes deeper inside each asset.
A single cable can hold hundreds of fibres, and each fibre can serve a different customer. So telecom GIS must track splices, port use and spare capacity. In fact, Esri says its telecom domain network handles very large numbers of circuits, gaps in connectivity and shared resources. Similarly, GE Vernova offers Smallworld Network Inventory for Telecom for planning, design, build and operation.
- Plan routes using existing ducts, poles and rights of way first.
- Design cables, splices and splitters next for each area.
- Build the network and then record it from field data.
- Operate the network while tracking circuits, faults and spare fibres.
In Malaysia, fibre rollout has grown under JENDELA, the national digital infrastructure plan announced in August 2020. In particular, at launch it aimed to give 7.5 million premises access to gigabit-speed fixed broadband. As a result, operators must record large volumes of new fibre quickly. Our telecom GIS team supports this work.
Which systems does a utility GIS connect to?
A utility GIS usually connects to outage management (OMS), SCADA, ERP and customer systems (CRM). Each link gives those systems a correct picture of the network, and in return the GIS gains live status or business data.
| System | What it gets from GIS | What it gives back |
|---|---|---|
| OMS and ADMS | Network links and customers, so it can trace outages. | Outage and switch events. |
| SCADA | Device places and IDs, so alarms show on the map. | Live readings and states. |
| ERP | Asset places and links. | Costs and work orders. |
| CRM and billing | Supply point for each customer. | Accounts and complaints, so faults link to callers. |
For electric firms, the IEC 61968 series defines interfaces for power system management. So many electric links use its Common Information Model to swap network data. However, other networks rely more on vendor tools or custom links. Either way, stable asset IDs matter most, because a changed ID can break every link at once.
In our experience, a utility GIS succeeds or fails on its links. But a good map that cannot feed the outage system or the work order system soon loses the trust of the business.RedPlanet Solutions
Need help linking your GIS with OMS, SCADA or ERP? Our consultants can review your current setup.
Talk To Our Consultants →How should a utility choose a GIS platform?
Choose a utility GIS platform by how well it fits your networks, links, skills and budget. Brand matters less than how the platform handles your network model and your daily work.
The main options include GE Vernova Smallworld, Esri ArcGIS, Hexagon and open source tools such as QGIS with GeoServer. Each has strengths, but none fits every case. For example, Smallworld and the ArcGIS Utility Network both offer full network models, while open source tools can suit viewing and light editing at lower licence cost. Our comparison of QGIS vs ArcGIS for utilities covers one common choice.
You run one large electric or gas network with complex links.
A full network platform such as Smallworld or the ArcGIS Utility Network.
You manage several networks in one organisation.
A platform with a shared structure model and separate network domains.
You mainly need viewing and light edits for field teams.
Open source tools such as QGIS and GeoServer alongside a core system.
You run a fibre network with heavy circuit tracking.
A platform with a telecom model for circuits, ports and splices.
Choosing on demos alone
Test the platform with your own data and your hardest network case, rather than a sample set.
Ignoring links
Also check how the platform will feed OMS, SCADA and ERP before you sign.
Underrating data work
In fact, data cleansing and migration often take more effort than the software setup.
Forgetting the field
Crews need simple mobile tools, so check the field app as well as the desktop.
However, no platform fixes poor data or unclear processes. If your records have gaps today, a new GIS will show those gaps more clearly. So budget for data checks and field work alongside the software.
Finally, think about the field. In fact, many records improve fastest when crews can update them on site. Our guide to mobile GIS field data collection explains how to set this up.
What should Malaysian utilities consider when planning GIS?
Malaysian utilities should plan GIS around their regulators, their loss and growth targets and local data rules. Also, each network type faces its own pressure, so the GIS plan should reflect it.
For water firms, therefore, loss targets make accurate main and meter records a priority. Meanwhile, electric and gas firms report to the Energy Commission in Peninsular Malaysia and Labuan, so they need audit-ready records. Telecom operators, in turn, must record fast fibre growth without letting data quality slip.
Also, customer data in a utility GIS falls under the Personal Data Protection Act. So if you plan cloud hosting or offshore support, check your data flows with your legal team first. In short, a good GIS plan treats data rules as part of the design, not an afterthought.
Frequently Asked Questions
What is GIS for utilities?
GIS for utilities is a geographic information system that models a utility network, such as power lines, water mains, gas pipes or fibre cables. It records where each asset sits and how it connects. So teams can trace flows, isolate faults, plan new work and share one network record with other business systems.
How is a utility GIS different from a normal map?
A normal map shows where things are. However, a utility GIS also stores how assets connect and which way supply flows. That means it can trace a fault, find affected customers or show which valve or switch isolates a section. In short, it works as a network model, not just a picture.
Can one GIS manage electric, water, gas and telecom networks?
Yes. A single GIS can hold several networks if its data model shares common items, such as poles, ducts and base maps, and keeps separate rules for each network. For example, the ArcGIS Utility Network uses separate domain networks with one shared structure network. This approach cuts duplicate data for multi-utility firms.
Which systems should a utility GIS integrate with?
Most utility GIS platforms link to outage management or ADMS, SCADA, ERP and customer or billing systems. The GIS sends network links, asset places and supply points. In return, it gets live states, work orders and customer data. Stable asset IDs are the key to keeping these links working over time.
Which GIS platform is best for utilities?
There is no single best platform. Smallworld and the ArcGIS Utility Network suit complex network models, while QGIS and GeoServer can suit viewing and light editing. So choose by network fit, links, skills and total cost. Our GIS consultants can help you test options with your own data.
How long does it take to set up a utility GIS?
It depends on the size of the network, the state of current records and the number of system links. A small viewing setup can move quickly. But a full network model with data migration and OMS or ERP links takes longer. So plan by phases, such as design, data, links and testing, rather than one fixed date.
What is the best way to start with GIS for utilities?
Overall, the best start is a clear view of your networks, your data and the systems that depend on them. Then you can choose a model and platform that fit, rather than forcing your work into a tool.
First, list the networks you run and the key tasks for each one. Next, check the quality of your current records. Then map the links your GIS must feed, such as OMS, SCADA, ERP and CRM. Finally, test short-listed platforms with your own data. As a result, your teams get one trusted network record that supports safe, efficient work every day.
Plan Your Utility GIS With Experienced Network Consultants
RedPlanet Solutions helps electric, water, gas and telecom utilities design network models, migrate and clean data, and link GIS with OMS, SCADA and ERP. Talk to us about your utility GIS plans.
Talk To Our GIS Consultants
PK Senthilkumar is CEO of RedPlanet Solutions. His work focuses on GIS consulting, network-based GIS for utilities, enterprise GIS modernisation and practical spatial decision-making for organisations operating across Malaysia, India, Australia and international markets.
About RedPlanet Solutions
RedPlanet Solutions (M) Sdn Bhd is a Malaysia-based GIS consulting and geospatial services company and part of RedPlanet Berhad. The company delivers GIS for electric utilities, spatial data collection, drone surveying, mobile mapping and GIS software development to utilities, government agencies, smart cities and private sector organisations across Southeast Asia, the Middle East, Australia and beyond. RedPlanet works across leading commercial and open-source GIS ecosystems, including GE Vernova Smallworld, Esri, Hexagon, SuperMap, QGIS, GeoServer and FME.