
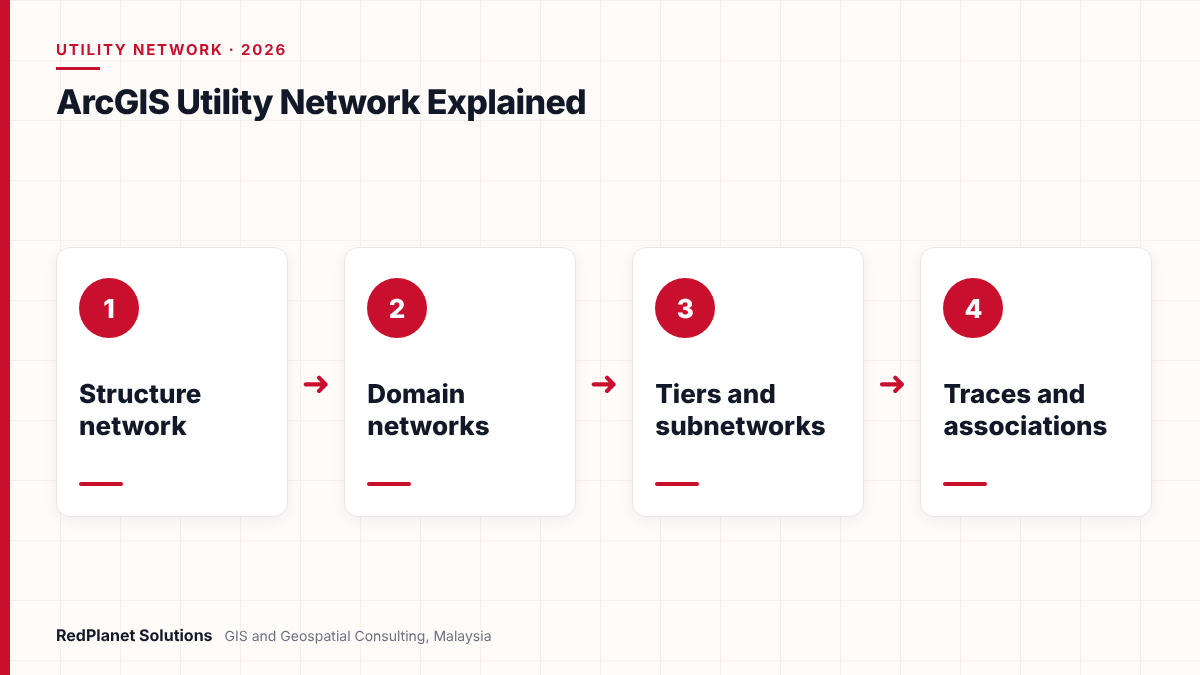
The ArcGIS Utility Network is Esri’s model for utility networks in ArcGIS Pro and ArcGIS Enterprise. It holds a shared structure network plus one or more domain networks, such as electric or water. Tiers and subnetworks organise each domain, associations link related assets, and built-in traces answer flow and isolation questions. It replaces the older geometric network.
- The ArcGIS Utility Network models each resource as a domain network that sits on a shared structure network of poles, vaults and ducts.
- Tiers group subnetworks, and a subnetwork is the part of a tier that traces back to the same controllers, such as a feeder or pressure zone.
- Associations link assets that do not touch on the map, for example a transformer inside a vault or a cable on a pole.
- Esri offers free Utility Network Foundations for electric, gas, water, sewer, stormwater, district energy and communications.
- Geometric networks are read-only in ArcGIS Pro, so firms that still edit them should plan their migration now.
What is the ArcGIS Utility Network?
The ArcGIS Utility Network is Esri’s data model and toolset for networks that carry a resource, such as power, gas, water or data. It runs in ArcGIS Pro and ArcGIS Enterprise, and it replaces the older geometric network from the ArcMap era.
In short, it treats the network as a connected system, not just lines on a map. Each asset knows what it connects to, what holds it and what feeds it. As a result, a planner can trace a feeder, find the valves to close for a burst main or check which customers sit on a circuit. Our Esri ArcGIS services help utilities design and run these models.
However, the model is strict by design. It uses rules for what can connect, what can sit inside what and which assets belong in each tier. So data quality and design choices matter far more than they did with simple feature classes. For a wider view of the sector, see our guide to GIS for electric, water, gas and telecom utilities.
How do the structure network and domain networks fit together?
In short, every utility network has one structure network and one or more domain networks. The structure network holds the things that support assets, while each domain network holds the assets that carry the resource.
First, the structure network comes with three feature classes. StructureJunction holds points such as poles, pads and vaults. StructureLine holds trenches, duct banks and span guys. Then StructureBoundary holds areas such as a substation footprint. No resource flows through these features, but they support and contain the assets that do.
| Part | What it holds | Example |
|---|---|---|
| Structure network | Supports and containers, but no flow. | Poles, vaults and duct banks, for instance. |
| Domain network | Assets that carry the resource. | Electric distribution, for example. |
| Devices | Assets that control or change flow. | Switches and valves, since they set flow. |
| Lines | Edges along which flow moves. | Cables, mains and fibre, so flow can move. |
| Junctions | Points where lines meet. | Taps and fittings, so lines join. |
Next, each domain network models one system. For example, a water firm may set up one domain for distribution and another for transmission. Also, Esri offers two domain types. A traditional domain suits flow systems with sources or sinks, such as electric feeders or sewer. A telecom domain suits the very large feature counts and circuit work of telecom networks.
Inside each domain, however, two fields do most of the work. ASSETGROUP and ASSETTYPE sort features into groups such as transformers and then into types such as a pole-mounted unit. Because rules attach to these values, a few feature classes can stand for hundreds of real asset types.
What are tiers and subnetworks in the utility network?
A tier is a set of subnetworks that share the same rules, such as all medium voltage feeders. A subnetwork is one part of a tier in which every feature traces back to the same controllers. For instance, one feeder or one pressure zone is a subnetwork.
According to Esri’s tier documentation, each domain picks one of two tier types when you create it. Partitioned tiers suit electric and telecom systems, where each feature sits in one tier only. Hierarchical tiers suit gas and water, where tiers nest and a feature can sit in more than one. So this choice shapes the whole design.
How does a subnetwork stay up to date?
In practice, a subnetwork starts when you set a device or junction as its controller, such as a circuit breaker or a regulator station. Edits then follow a set cycle. First, you validate the topology, which marks the subnetwork Dirty. Next, Update Subnetwork traces from every controller and writes the subnetwork name onto each feature. If it succeeds, the subnetwork turns Clean. If it finds errors, it turns Invalid until you fix them.
Also, you can export only a Clean subnetwork. That rule matters when an outage system or ADMS takes its model from GIS. Our guide to schematic diagrams from GIS shows how clean network data feeds other views.
What are associations in the ArcGIS Utility Network?
Associations link assets that do not share a location on the map. So they let one model show what connects to what, what holds what and what hangs on what, without heavy drawing work.
Connectivity
This type links features that do not touch, for example a meter and the service point it feeds.
Containment
This type puts content inside a container, for example a transformer inside a vault or a switch in a cabinet.
Structural attachment
This type ties an asset to a structure, for example a cable or a transformer on a pole.
Esri’s associations page explains that rules control which features you can link. In addition, each container or structure has delete rules. For instance, a Cascade rule removes a transformer if someone deletes its vault. A Restricted rule blocks that delete instead. So agree these rules with field and asset teams before you load data.
In addition, containment keeps busy maps readable. A substation or a chamber can hold dozens of devices, but the map can show just the container until a user opens it. As a result, editors work faster in dense urban areas.
Which trace types does the utility network support?
The Trace tool in ArcGIS Pro offers eight trace types. Together, they also answer the daily questions that control rooms, planners and field crews ask about flow and isolation.
| Trace type | What it finds | Typical use |
|---|---|---|
| Connected | All features linked to a start point. | Checks if data links up. |
| Subnetwork | The full extent of a subnetwork. | Maps a feeder, so staff see its reach. |
| Subnetwork controllers | The sources or sinks of a subnetwork. | Shows which breaker feeds it. |
| Upstream | Features towards the source. | Tracks back if supply drops. |
| Downstream | Features away from the source. | Lists customers if a fault occurs. |
| Loops | Areas where flow is unclear. | Flags meshes so teams can fix them. |
| Shortest path | The shortest route between two points. | Checks a route before work starts, so crews plan. |
| Isolation | The features that cut off an area. | Lists valves to close if a main bursts. |
However, a trace is only as good as the data behind it. A single gap in a cable, a wrong terminal or a switch with the wrong state can stop a trace early. Therefore, most teams build test traces on sample feeders and zones, then rerun them after each data load.
Terminals also add more control. A transformer, for example, can carry a high side and a low side, so a trace follows the right path through it. Our electric network model data checklist covers the fields that tracing needs.
Which industry data models are available for the utility network?
Esri publishes free Utility Network Foundations as starting points for each industry. Each one gives a baseline model that you extend later, rather than a full model for every asset.
In particular, the foundations cover communications, district energy, electric, gas and pipeline referencing, sewer, stormwater and water distribution. Also, each comes with an asset package, maps for editing and publishing, sample data and workflow examples. In 2024, Esri also added Essential Data Models for water, sewer and electric. These hold only the core asset groups, types and fields, so teams can test a migration faster.
Electric
Here, partitioned tiers suit feeders, transformers and switching from substation to service point.
Gas
Hierarchical tiers suit pressure systems, since regulator stations act as controllers.
Water and sewer
Water uses pressure zones, while sewer uses sink-based controllers such as treatment plants.
Telecom
A telecom domain also handles very large counts of fibres, ports and circuits.
In our view, start from the closest foundation and change as little as you can. That is because every extra field or rule adds load, test and upgrade work later. If you also run Smallworld, our comparison of Smallworld Electric Office and the ArcGIS Utility Network sets out how the two models differ.
How do you migrate from a geometric network to the utility network?
Most firms migrate by mapping their geometric network data to a foundation model, loading it with Esri tools or FME, and then fixing errors until traces pass. So the work is mostly data work, not software work.
Also, time is now short. Esri stated that ArcMap 10.8.2 would keep its support until 1 March 2026. Also, Esri support notes say geometric networks are a read-only dataset in ArcGIS Pro. So teams that still edit a geometric network in ArcMap now rely on an unsupported desktop.
- Assess the source model, its custom fields and its data quality.
- Map each feature class, subtype and domain to asset groups, asset types and fields.
- Load a trial area, such as one feeder or pressure zone.
- Validate the topology and fix connectivity errors.
- Test traces, then repeat the load for the full network.
Esri’s Migrate To Utility Network tool can build a utility network in a mobile geodatabase from geometric network data. It also writes a data loading workspace for the next steps. Meanwhile, Safe Software offers FME migration workspaces for water, gas and electric that use a mapping spreadsheet. As an authorised partner, we build these flows through our FME services and wider GIS data migration work.
Safe Software marks its electric migration workspaces as beta, not for production use. Also, FME writes a GUID field rather than a GlobalID, so Esri tools must convert the values later. So plan time for these extra steps.
Planning a move from a geometric network? Our consultants can review your data and design.
Talk To Our Consultants →What should you plan before an ArcGIS Utility Network project?
First, plan the platform, the data and the people before you load a single feature. Most delays come from late design choices and poor source data, not from the software.
To begin, check the platform. An enterprise setup uses an enterprise geodatabase, branch versioning and services in ArcGIS Enterprise. Editors then need the ArcGIS Advanced Editing user type extension. In addition, Esri notes that Update Subnetwork has a 30 minute time-out when it runs in sync, so very large subnetworks need care.
ArcGIS Utility Network readiness checklist
Use these checks before you start the first full load.
Copying the old model
A straight copy of the geometric network keeps old habits and misses the new rules.
Skipping data cleansing
Broken links that hid in ArcMap now show up as topology errors, so fix them early.
Loading everything at once
A small trial area shows mapping errors fast, while a full load hides them in noise.
Late field input
Crews know which valves and switches really exist, so involve them in the design.
In our experience, the utility network rewards clean data and punishes shortcuts. So we treat data quality as its own work stream, with its own pass marks.RedPlanet Solutions
Also, think about the grid ahead. For example, Malaysia’s National Energy Transition Roadmap targets 70 percent of generation capacity from renewable sources by 2050. Therefore, electric models will need to hold far more rooftop solar and storage. Independent GIS QA/QC helps keep that growing model trusted.
Frequently Asked Questions
What is the ArcGIS Utility Network?
The ArcGIS Utility Network is Esri’s network model for electric, gas, water, sewer and telecom firms. It runs in ArcGIS Pro and ArcGIS Enterprise. It uses a structure network, domain networks, tiers and subnetworks, and it adds associations and eight trace types. In short, it replaces the older geometric network used with ArcMap.
What is the difference between a geometric network and the utility network?
A geometric network links features mainly by shared geometry and belongs to the ArcMap era. The utility network adds tiers, subnetworks, terminals, containment and structural attachments, plus richer traces. Also, geometric networks are read-only in ArcGIS Pro. So firms that want to keep editing in a supported desktop need to migrate to the utility network.
What is a subnetwork in the utility network?
A subnetwork is a part of a tier in which every feature traces back to the same controllers. For example, an electric feeder or a water pressure zone is a subnetwork. Its status moves from Dirty to Clean when Update Subnetwork runs. If that update finds errors, the status becomes Invalid until you fix them.
Are the Utility Network Foundations free?
Yes. Esri says its Utility Network Foundations come at no extra cost to ArcGIS users. They cover electric, gas, water distribution, sewer, stormwater, district energy and communications. Each includes an asset package, maps, sample data and workflow examples. However, they are baseline models, so most utilities extend them to fit their own assets.
Can FME migrate data to the ArcGIS Utility Network?
Yes. Safe Software provides FME workspaces for water, gas and electric that read geometric network data and load the utility network model. A mapping spreadsheet drives asset groups, types and fields. However, the electric workspaces are beta. Our FME team can adapt these flows to your data model.
What licences does the ArcGIS Utility Network need?
Esri says both single-user and enterprise setups need an ArcGIS Standard or Advanced desktop licence. In addition, an enterprise setup needs ArcGIS Enterprise with branch versioning. To create, publish and edit the network there, users need the ArcGIS Advanced Editing user type extension. Query and trace work does not need that extension.
Is the ArcGIS Utility Network right for your utility?
For most Esri users, the ArcGIS Utility Network is now the only supported way to edit a connected network in ArcGIS Pro. Also, it gives richer tracing, clearer structure and better links to field and control room systems than the geometric network.
However, it asks more of your data and design. So start from an Esri foundation, choose tiers with care and load a trial area first. Then test traces, fix errors and repeat. If you are still weighing platforms, our QGIS vs ArcGIS for utilities guide may help. As a result, you get a network model that your teams can trust.
Expert Guides
Related GIS Guides
 GuideSmallworld Electric Office vs ArcGIS Utility Network: How They Compare for Electric UtilitiesCompare Smallworld Electric Office and ArcGIS Utility Network for electric utilities: data model, tracing, design, versioning, cloud, skills and migration.Read the guide →
 GuideQGIS vs ArcGIS for Utilities: Which Fits Your Network Data Workflow?QGIS vs ArcGIS for utilities: compare licensing, ArcGIS Utility Network modelling, editing, data formats, integration and hybrid setups to pick your fit.Read the guide →
Plan Your ArcGIS Utility Network With Experienced Utility GIS Consultants
RedPlanet Solutions helps utilities design utility network models, clean and migrate geometric network data with FME, and test traces before go-live. Talk to us about your migration plan.
Talk To Our GIS Consultants
PK Senthilkumar is CEO of RedPlanet Solutions. His work focuses on GIS consulting, network-based GIS for utilities, enterprise GIS modernisation and practical spatial decision-making for organisations operating across Malaysia, India, Australia and international markets.
About RedPlanet Solutions
RedPlanet Solutions (M) Sdn Bhd is a Malaysia-based GIS consulting and geospatial services company and part of RedPlanet Berhad. The company delivers GIS for electric utilities, spatial data collection, drone surveying, mobile mapping and GIS software development to utilities, government agencies, smart cities and private sector organisations across Southeast Asia, the Middle East, Australia and beyond. RedPlanet works across leading commercial and open-source GIS ecosystems, including GE Vernova Smallworld, Esri, Hexagon, SuperMap, QGIS, GeoServer and FME.