Augmented reality for utilities places buried pipes, cables and ducts from GIS on a live camera view, so crews can see assets before they dig. It works best with clean GIS data, depth values and high-accuracy GNSS. However, AR does not replace locating or potholing. Instead, it helps crews plan, check marks and avoid strikes.
- AR for utilities draws GIS assets such as pipes, cables and valves over a live camera view at their real location.
- A phone alone gives only a few metres of accuracy, so crews need RTK GNSS or visual positioning for close work.
- Also, AR can only be as good as the GIS records, so depth, quality levels and QA/QC matter as much as the device.
- AR supports dig safety by showing likely conflicts early, but crews must still locate and expose assets before they dig.
- Finally, start with one network, one area and one clear task before you scale AR across field teams.
What is augmented reality for utilities?
Augmented reality for utilities shows network assets from a GIS on top of a live camera view. So a crew member can point a tablet at a road and see the water main, the cable duct and the gas service below it.
In simple terms, the device knows where it is and which way it faces. Then it draws each asset at its mapped place and depth. As a result, a flat map turns into a 3D view that matches what the crew sees on site. Field staff no longer need to read a plan, pace out offsets and guess where a line runs.
However, AR is a view of your records, not a scan of the ground. It cannot see a pipe that your GIS does not hold. Also, it cannot fix a cable that your records place two metres away from its real route. That is why this guide spends as much time on data and accuracy as on the device. For a wider view of network GIS, see our guide to GIS for electric, water, gas and telecom utilities.
See
Crews view buried pipes, cables and ducts in place, with depth and asset details.
Check
Then teams compare paint marks and visible covers with the records before work starts.
Capture
Also, field staff log notes, photos and fixes against the asset they are looking at.
How does GIS data feed an AR view in the field?
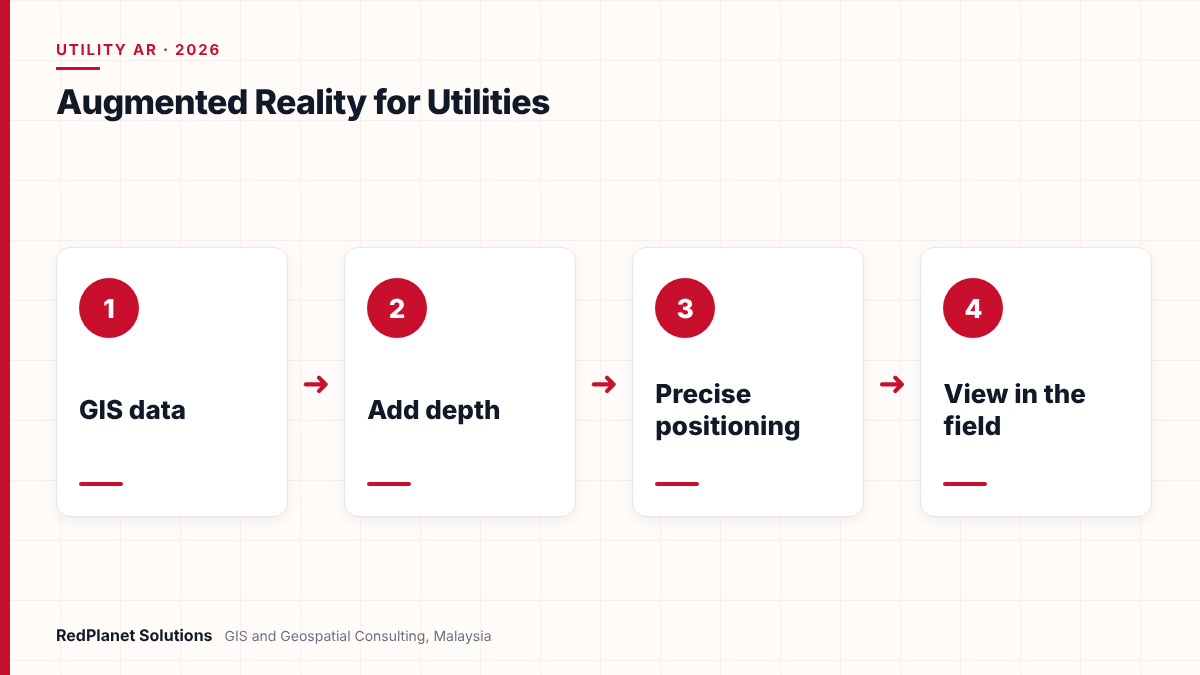
GIS data feeds AR through a chain of steps. First, the system takes network features from the GIS. Next, it adds depth and size, and then it streams them to a mobile app that places them in 3D.
But most utility GIS data is 2D. For example, a water main may exist only as a line with a diameter field. So the AR app needs a rule to turn that line into a pipe at the right depth. Sometimes the depth comes from survey records. In other cases, teams use a default cover depth and flag it as an estimate. Then the app also needs ground height, since depth is measured from the surface.
- Select the layers that matter for the task, such as mains, services, ducts and valves.
- Add depth from survey, as-built plans or a default value, and tag the source of each value.
- Build 3D pipes and cables from line width, diameter and depth fields.
- Publish the layers as a service that the mobile app can read, online or offline.
- Place the assets on the camera view using the device position, heading and ground height.
Esri offers a working pattern for this. Its ArcGIS Maps SDK sample for hidden infrastructure lets users draw pipes, set them above or below ground and view them in AR. In addition, the sample places pipes against Esri’s world elevation service. It also notes that buried pipes can seem to float, because of parallax. So crews need short training on how to read the view.
Data from mobile mapping can also help. For instance, LiDAR can capture covers, poles and kerbs with precise heights. Our article on LiDAR feature extraction for utilities explains how teams turn point clouds into GIS features that AR can use.
How accurate is augmented reality for underground assets?
AR accuracy depends on two things: where the device thinks it is, and where the GIS says the asset is. If either one is off, the pipe on screen will sit in the wrong place.
First, device position is the limit. According to GPS.gov, GPS-enabled smartphones are typically accurate to within 4.9 metres under open sky. Also, accuracy gets worse near buildings, bridges and trees. That is a common setting for a utility trench in a city. So a phone on its own is fine for a quick look, but not for close work near a live cable.
However, high-accuracy GNSS closes much of that gap. GPS.gov notes that dual-frequency receivers and correction systems can give real-time positions within a few centimetres. For example, Trimble lists centimetre RTK accuracy for its SiteVision system when paired with a Catalyst DA2 receiver. It also says SiteVision can show underground services. Another option is visual positioning. Google says its ARCore Geospatial API matches the camera view with a model built from Street View imagery. As a result, it can be far more accurate than GPS alone, though it only works where Street View coverage exists.
| Option | Typical use | Main limit |
|---|---|---|
| Phone GNSS only. | Quick look and planning. | Metres of error. |
| Visual positioning. | Street work in mapped areas. | Needs Street View coverage. |
| RTK GNSS receiver. | Close work and marking checks. | Extra kit and corrections. |
| Local calibration. | Small sites and indoors. | Needs known control points. |
Even with centimetre GNSS, the asset can still sit in the wrong place if your records are wrong. So treat the AR view as a guide to where you expect assets to be. Then prove it with a locator, and expose the line by hand or vacuum before you dig near it.
Why does GIS data quality decide whether AR can be trusted?
Data quality decides trust because AR shows your records with great confidence, whether they are right or wrong. In fact, a neat 3D pipe on screen can look more certain than the paper plan it came from.
For example, one useful tool is the ASCE 38 standard for subsurface utility data. It sorts each record into four quality levels, from desk records up to exposed and measured assets. So if you tag each asset with its level, the AR app can show crews how far to trust each line. For instance, it could draw verified lines in solid colour and record-only lines as dashed.
| Level | Source | AR use |
|---|---|---|
| QL-D. | Existing records and GIS. | So use it for planning only. |
| QL-C. | Surveyed visible features. | Better route guide. |
| QL-B. | Geophysical locating, then survey. | Good for marking checks. |
| QL-A. | Exposed and measured. | So it earns the highest trust. |
For instance, Malaysia shows why this matters. A 2015 FIG paper by JUPEM staff says the agency set up its utility mapping work in 2006 after a Cabinet directive. That directive followed frequent water and power cuts caused by damage to pipes and cables during digging. The same paper reports that much provider data failed JUPEM’s accuracy standards during field checks. Also, it notes a 2014 decision that new utilities must be surveyed by licensed land surveyors during installation.
Therefore, run a data check before any AR pilot. Look for missing depth, missing size, broken links and lines that cross buildings. Our GIS data QA/QC checklist for utilities sets out the tests we use.
How does AR help prevent dig damage to buried utilities?
AR helps prevent dig damage by showing crews where assets should be before the bucket hits the ground. But it works as one layer of defence, next to one-call checks, locating and potholing.
Yet dig damage is still common in mature markets. For example, the Common Ground Alliance’s 2024 DIRT report for North America analysed 196,977 unique damage reports. In addition, the top ten root causes made up 85 percent of reported damages. Several of these causes are ones a good AR view can support.
So where does AR help most? First, it shows the line during digging, even after paint marks fade or vanish. Next, it lets a supervisor check marks against records and spot a missed asset. Then it can warn when a planned trench crosses a high-risk line. However, the same report lists incorrect records or maps as a root cause. That is a reminder that AR spreads bad records just as fast as good ones.
In our experience, AR changes the conversation on site. Crews stop asking where the cable is and start asking how sure the record is. That is exactly the right question.RedPlanet Solutions
What are the main use cases for AR in utility field work?
The main use cases are dig planning, locating support, maintenance, inspection and as-built capture. In each case, AR saves time because crews see the network in place instead of on a plan.
Dig planning
First, planners walk a route and see which mains and ducts a new trench will cross.
Locating support
Locators use the view as a starting point, then confirm each line with their own tools.
Valve and switch finding
So crews find buried valves, chambers and joints faster, even under grass or new paving.
Leak and fault work
In addition, teams trace a pipe or cable route on site to narrow down a leak or fault location.
As-built capture
Crews record the real position of new assets while the trench is open, so the GIS improves.
Public and client briefings
Also, project teams show councils and landowners where works will run, in plain visual form.
As-built capture deserves special attention. Each time a crew exposes a line, they can log its true position and depth. As a result, that asset moves up to a higher quality level, and the next AR view gets better. Our guide to mobile GIS field data collection for utilities covers how to build that loop.
Also, AR fits well with a utility digital twin. The twin holds the 3D network, and AR brings that model to the street. For water networks in particular, see our water utility GIS page.
Want to see your own network in AR? Our team can scope a small pilot on one area.
Talk To Our Consultants →Is your utility ready for an AR field pilot?
A utility is ready for an AR pilot when it has usable GIS data for one area, a clear field task and a plan for positioning. You do not need a perfect network model to start. But you do need to know where the gaps are.
AR readiness checklist for utilities
Work through these checks before you buy devices or licences.
Starting with the device
However, buying headsets or tablets first hides the real work, which is data and process.
Ignoring depth
Without depth values, AR shows pipes at a guessed level, and crews may trust it too much.
Using phone GPS for close work
Because metres of error are fine for planning, but not near a live cable or gas main.
No feedback loop
If field fixes never reach the GIS, the same errors appear on every visit.
Replacing the locate
AR supports locating and potholing, so never treat it as a replacement for either.
Then pick one network and one district for the pilot. Measure simple things, such as time to find a valve or the number of marks that differ from records. If you need help closing data gaps first, our field data collection team can survey assets to a known accuracy.
Frequently Asked Questions
What is augmented reality for utilities?
Augmented reality for utilities places GIS assets such as water mains, gas pipes and power cables on a live camera view at their mapped location and depth. So field crews can see buried networks on a tablet or phone before they dig. However, it shows records, not a scan of the ground, so it relies on good GIS data.
How accurate is utility AR on a normal smartphone?
GPS.gov says GPS-enabled smartphones are typically accurate to within 4.9 metres under open sky, and worse near buildings and trees. That is fine for planning but not for close work. So for marking checks, most teams add an RTK GNSS receiver or use visual positioning, which can bring accuracy down to centimetres in good conditions.
Can AR replace utility locating or potholing?
No. AR shows where your records say assets are, but records can be wrong or incomplete. So crews should still use one-call services, electromagnetic locators or ground penetrating radar, and then expose lines by hand or vacuum before digging close to them. AR supports these steps by making the expected route visible on site.
What GIS data do I need for an AR pilot?
You need network lines and points with size, material and depth fields, plus a ground height model. Also, each record should carry a source or quality level, such as the ASCE 38 levels. Then run QA/QC on the pilot area first. Our QA/QC checklist covers the key tests.
Which software can show underground utilities in AR?
Several options exist. For example, Esri’s ArcGIS Maps SDKs include a sample that shows hidden pipes in AR. In addition, Trimble SiteVision displays georeferenced models, including underground services, with an RTK GNSS receiver. Google’s ARCore Geospatial API also offers visual positioning that custom apps can use. So the right choice depends on your GIS platform and task.
How does AR improve GIS data over time?
AR improves data when crews log fixes on site. For instance, when a trench is open, a crew can record the true position and depth of an exposed line. Then the GIS team updates the record and raises its quality level. As a result, each visit makes the next AR view more reliable for the next crew.
Is augmented reality for utilities worth adopting now?
Yes, for most utilities with a working GIS, AR is worth a focused pilot now. The tools have matured, and high-accuracy positioning is easier to get. But the return depends on your data, not on the headset.
So start small. First, clean one area and tag each asset with a quality level. Next, choose the right positioning for the task. Then train crews to read the view and keep locating and exposure in the process. Finally, feed every field fix back to the GIS. RedPlanet’s augmented reality for asset management service can help you plan and run that pilot, from data checks to field roll-out.
Expert Guides
Related GIS Guides
 GuideMobile GIS Data Collection for Utilities: Field Workflows That Cut ReworkMobile GIS data collection for utilities: form design, GNSS accuracy, offline sync, photo standards and QA at source that cut field rework.Read the guide →
 GuideGIS for Utilities: How Electric, Water, Gas and Telecom Networks Use GISGIS for utilities explained: how electric, water, gas and telecom networks use GIS, shared data models, OMS, SCADA and ERP links, and platform choice.Read the guide →
Bring Your Underground Network Into View With AR
RedPlanet Solutions helps utilities prepare GIS data, choose positioning and run AR field pilots that crews can trust. Talk to us about seeing your buried assets in the field.
Talk To Our GIS Consultants
PK Senthilkumar is CEO of RedPlanet Solutions. His work focuses on GIS consulting, network-based GIS for utilities, enterprise GIS modernisation and practical spatial decision-making for organisations operating across Malaysia, India, Australia and international markets.
About RedPlanet Solutions
RedPlanet Solutions (M) Sdn Bhd is a Malaysia-based GIS consulting and geospatial services company and part of RedPlanet Berhad. The company delivers GIS for electric utilities, spatial data collection, drone surveying, mobile mapping and GIS software development to utilities, government agencies, smart cities and private sector organisations across Southeast Asia, the Middle East, Australia and beyond. RedPlanet works across leading commercial and open-source GIS ecosystems, including GE Vernova Smallworld, Esri, Hexagon, SuperMap, QGIS, GeoServer and FME.