
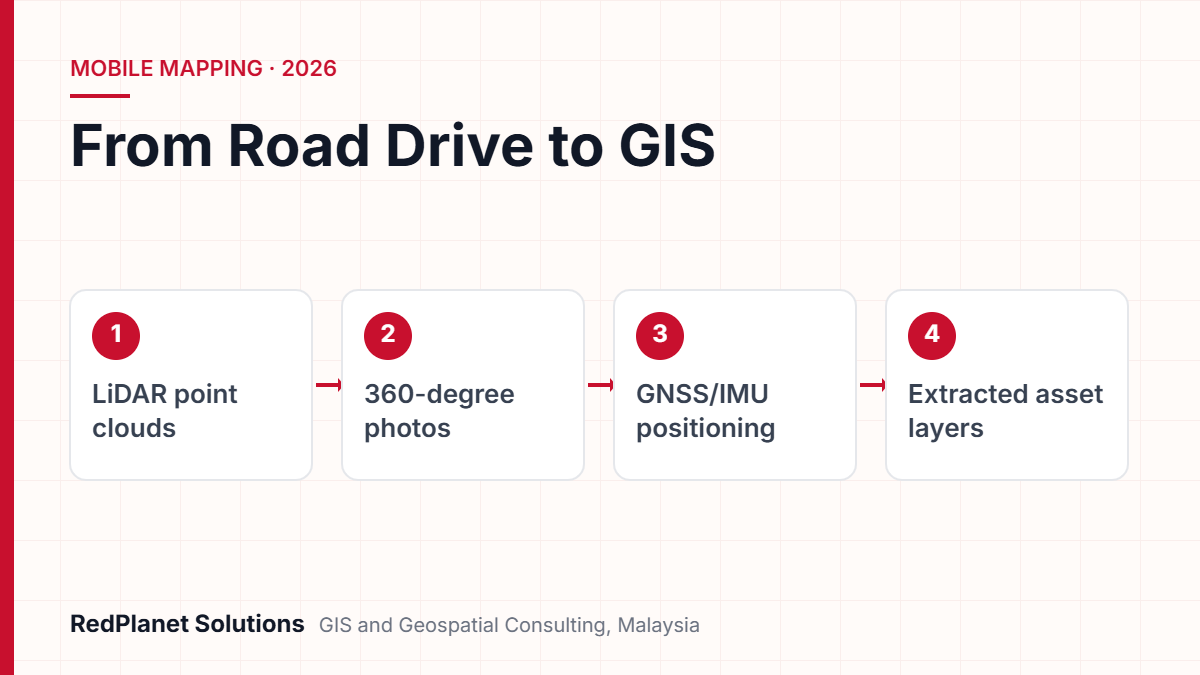
A mobile mapping survey uses a vehicle fitted with LiDAR scanners, cameras and a GNSS/IMU unit. While it drives at normal speed, it captures 3D point clouds and 360-degree street photos, all tied to map positions. So utilities can then list poles, streetlights, signs and road furniture, check tree clearance and update GIS records across whole road networks.
- A mobile mapping system puts LiDAR, cameras and GNSS/IMU on one vehicle, so it can map streets at traffic speed.
- Map accuracy depends mostly on satellite signal, data processing and ground control, so the laser specification alone tells you little.
- Mobile mapping suits long roads, while drones suit open sites and field teams suit close checks.
- The main outputs are point clouds, 360-degree photos, extracted assets and GIS layers.
- AI speeds up asset extraction, but a clear QA/QC step is still needed before data enters your network model.
What Is a Mobile Mapping Survey and How Does It Work?
A mobile mapping survey captures 3D data and photos from a moving vehicle. Sensors record the street while a positioning unit tracks where the vehicle is at every moment.
As a result, you get a digital record of everything you can see from the road. For example, it shows poles, overhead lines, streetlights, signs, kerbs and roadside trees. Because the vehicle drives with traffic, a crew covers far more ground in a day than a walking team. So it is a practical way to build or refresh an asset register across a whole service area.
What are the parts of a mobile mapping system?
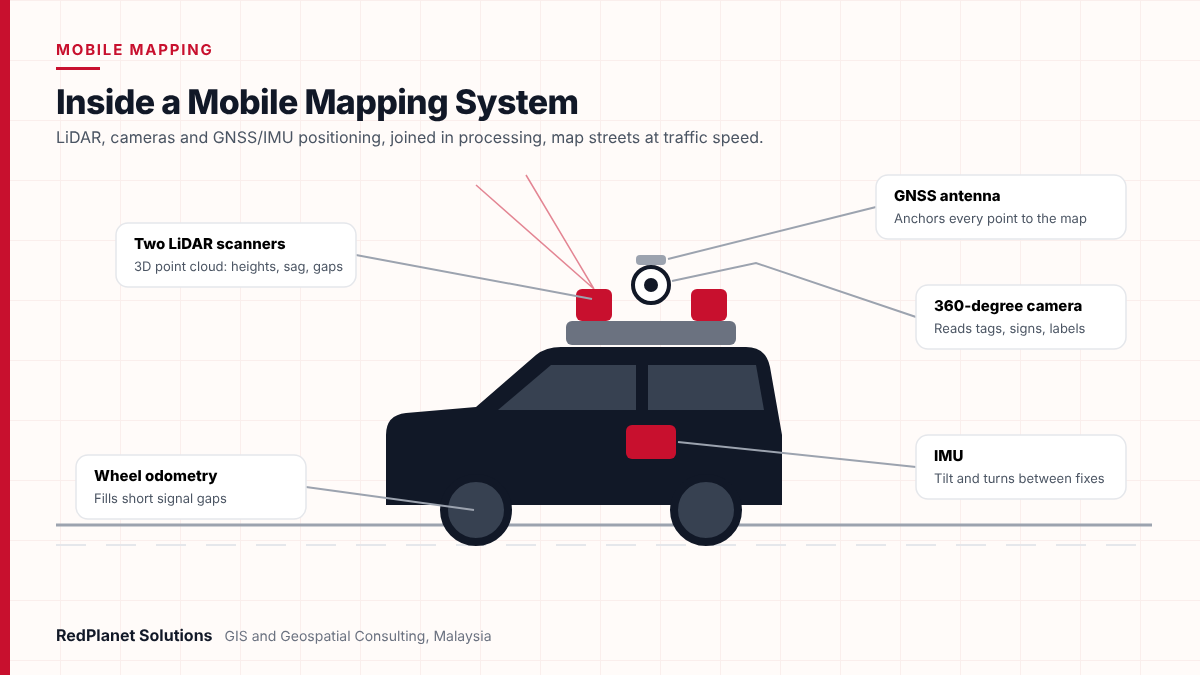
Every mobile mapping system uses three groups of sensors. Each one does a different job, so none works alone. However, the data only becomes useful once all three are joined in processing.
LiDAR scanners
First, lasers send out pulses and time the return. That builds a dense 3D point cloud, so mobile lidar mapping can measure pole height, line sag and clearance.
Cameras
Spherical cameras take street-level imagery. As a result, staff can read pole tags, sign faces and labels from the office.
GNSS receiver
Since satellite signals give the vehicle’s position, they anchor the data to the map. The fix gets better when it uses nearby base stations.
IMU and odometry
An inertial unit tracks tilt and turns. Then a wheel sensor helps fill gaps when the satellite signal drops.
For instance, the Trimble MX50 pairs a dual laser system with a 30 MP spherical camera and a built-in GNSS and inertial unit. Other vendors use the same basic design. Still, sensor grades and software vary a lot.
How Accurate Is Mobile LiDAR Mapping for Utility Assets?
Mobile lidar mapping is often good to a few centimetres if the satellite signal is strong and the survey uses ground control. But the final figure depends far more on positioning than on the scanner itself.
However, vendors tend to quote two kinds of number. First, there is laser range precision, which tells you how well the scanner measures distance. Next, there is absolute accuracy, which tells you how close each point sits to its true place on the ground. In fact, buyers often mix the two up. So ask which one a proposal means.
What affects absolute accuracy?
- Satellite signal. Tall buildings, tunnels and trees block or bounce signals, so positions drift.
- Signal gaps. The IMU covers short gaps. But research cited by ISPRS authors found accuracy can drop fast once a gap lasts over 30 to 60 seconds.
- Base station distance. Also, position quality falls as the gap to the nearest base station grows.
- Ground control points. Surveyed points along the route let teams correct drift in the vehicle path.
- Sensor setup and processing. Careful sensor alignment and path processing affect every point, so errors here spread everywhere.
In one study on a 160 km road, adding control points at set spacing kept the worst height error within limits. But without them, one stretch went over the limit. So control planning matters as much as the hardware.
To set pass and fail rules, many projects use the ASPRS Positional Accuracy Standards, Edition 2. Notably, ASPRS approved it in August 2023. It uses RMSE as the single measure and also adds a 3D accuracy term.
In short, mobile mapping only sees what you can see from the road. For example, it cannot find buried cables or pipes. It also misses assets behind walls, inside private sites or along lanes the vehicle cannot enter. So plan other methods for those gaps.
How Does Mobile Mapping Compare With Drone and Manual Field Surveys?
Mobile mapping is often the fastest choice for long roads, while drones suit open sites. In contrast, field teams suit close checks. As a result, most utility programmes end up using two or three methods.
The table below compares the usual strengths. Still, real output depends on traffic, terrain, air rules and the detail you need. So treat it as a planning guide, not a fixed rule.
| Factor | Mobile mapping survey | Drone survey | Manual field survey |
|---|---|---|---|
| Best for | Roads and streets. | Open sites and substations. | Small areas and back lanes. |
| Poles and signs | Strong: faces and tags show. | Good for pole tops. | Strong, but slow. |
| Speed | High, at traffic speed. | Medium, set by flight time. | Low. |
| Limits | Needs road access. | Air rules and weather. | Labour cost and road safety. |
Therefore, a common pattern is to drive the roads first. Then fly a drone over substations and cross-country lines. Finally, send field teams to sort out the gaps. For this reason, our drone surveying services and field data collection teams often work alongside mobile mapping.
What Outputs Does a Mobile Mapping Survey Deliver?
A mobile mapping survey gives you four main outputs. These are point clouds, street photos, extracted assets and GIS layers. The first two are raw evidence, while the last two are what planners use each day.
Point clouds
Dense 3D points, often in the LAS format from ASPRS. Then points can be sorted into ground, buildings, trees, wires and poles.
360-degree street-level imagery
Panoramas tied to map positions let office staff check an asset without a site visit. You can also measure from them when linked to the point cloud.
Extracted assets
Each pole, light, sign or cabinet becomes a GIS feature. It also carries details such as height, type and condition.
GIS layers and reports
Clean layers load into Esri, Smallworld or QGIS. In addition, you get exception lists and clearance reports for field crews.
Also, agree on formats, map grids and data fields before the drive. If you change the data model after extraction, it adds cost and delay. In addition, plan how photos will be stored and shared, because a city’s worth of panoramas takes up a lot of space.
Which Utility Assets Can a Mobile Mapping Survey Capture?
A mobile mapping survey can capture almost any asset you can see from the road. In particular, the main targets for utilities and councils are poles, streetlights, signs, trees near lines and road furniture.
- Utility poles: The survey records place, height, lean, crossarms and tags, so you can update the asset register and plan inspections.
- Streetlights: It records column height and lamp type, which also helps plan LED upgrades.
- Signs: Road owners can check each sign’s place, face and mounting, then fix gaps in their sign lists.
- Tree clearance: The point cloud shows the gap between wires and trees, so crews can trim the worst spots first.
- Road furniture: Kerbs, barriers, bollards and covers also appear, which helps councils build city base maps.
For pole-heavy networks, much of the detection can run on its own if the models suit local assets. We explain that workflow in our article on AI-powered pole detection for inventory and inspection. Mobile mapping data is also the base for 3D city and network models. If you want more, read our piece on MMS-driven models for smart cities.
In Malaysia, street photos also raise a privacy point. This matters because the Personal Data Protection (Amendment) Act 2024 came into force in phases from January 2025. So it makes sense to blur faces and number plates before you share photos from any utility asset survey.
How Should You Plan a Mobile Mapping Survey?
Good planning starts with the asset list and the accuracy target, not with the vehicle. Once you know what you need and how exact it must be, the route and control plan follow.
Define assets and fields
First, list each asset type, the fields you need and the target GIS layout. Then match these to your network model.
Set accuracy rules
Agree the accuracy targets. Also agree how checkpoints will test them.
Plan routes and control
Then map the drive routes and base stations. Add ground control where the satellite signal is weak.
Schedule the drive
If you can, avoid peak traffic and heavy rain. Also plan around road works and permits.
Process, extract and check
Finally, process the vehicle path and extract features. Then run QA/QC before loading into GIS.
Next, run a short pilot on a typical stretch of road. A pilot of a few kilometres shows if your rules, layout and targets work. As a result, problems show up early, while they are cheap to fix.
Planning an asset survey across a road network and not sure which method fits?
Talk To Our Consultants →How Does AI Speed Up Data Extraction From Mobile Mapping?
AI models sort point clouds and spot objects in photos. So analysts review results instead of drawing every asset by hand, and the data reaches GIS sooner.
In fact, GIS platforms now ship trained models for this work. For example, Esri offers a pretrained power line model for point clouds in ArcGIS Pro. Esri has also shown a tree risk workflow. In it, wire and tree results are combined to find where trees come close to lines.
- First, sort the point cloud into ground, buildings, trees, wires and poles.
- Next, spot and read assets in the photos, such as pole tags and sign faces.
- Then join both results into one feature per asset.
- After that, compare the new features with your GIS to flag new, moved or missing assets.
- Finally, send the exceptions to analysts for review before the final load.
However, models trained elsewhere may struggle with local pole types, sign designs or dense tropical trees. So expect to tune them with local samples, and keep a human check in place. Our GIS QA/QC services exist for exactly this stage.
At RedPlanet, we see the drive as the easy part, because the real work comes after. That work is turning millions of points into asset records a network model can trust, and that takes clear rules and careful checks.RedPlanet Solutions
What Mistakes Should Utilities Avoid in Mobile Mapping Projects?
Most mobile mapping problems come from vague needs and weak checks, not from the sensors. Still, the same mistakes come up again and again in utility work.
Buying data without a data model
If you skip an agreed field list, the layers will not fit your GIS. As a result, teams must redo the work.
Mixing up precision and accuracy
For instance, a scanner’s millimetre precision says little about where points sit on the map. So ask for absolute accuracy and how it was tested.
Skipping ground control in dense areas
City centres and tree-lined roads weaken the satellite signal. So without control points, drift can push assets out of tolerance.
Trusting AI output without review
Even good tools still miss and mislabel objects. Therefore, sample checks and exception reviews are essential.
Ignoring photo privacy
Faces and plates that stay unblurred create legal and trust risks. This matters most if you share photos with contractors or the public.
Finally, plan how the data will stay current. Because poles get replaced and lights get upgraded, a one-off survey ages fast. But if you link survey results to work orders, the register stays accurate between drives.
Frequently Asked Questions
What is a mobile mapping survey?
A mobile mapping survey captures 3D point clouds and street photos from a moving vehicle. First, LiDAR measures shape, while cameras record detail and a GNSS/IMU unit tracks position. Then the data is processed into map-ready outputs. As a result, utilities and road owners can list roadside assets across whole networks without walking each street.
How accurate is mobile lidar mapping?
Accuracy depends mainly on satellite signal, data processing and ground control. For example, one ISPRS paper notes that many mobile scanners are rated at about 5 cm absolute accuracy with good GNSS. But dense city areas and tree cover reduce accuracy. So teams use control points to correct drift.
Is mobile mapping better than a drone survey?
Neither wins in every case. Mobile mapping suits roads because it captures side-on detail such as sign faces and pole tags. In contrast, drones suit open sites, substations and off-road lines. Many utility programmes use both, as our drone surveying page explains, while field teams sort out the gaps.
Can mobile mapping detect underground utilities?
No. Mobile mapping only records what the vehicle can see, so buried cables and pipes need other methods. However, it does capture surface signs such as manhole covers, valve boxes and cabinets. These features also help confirm where underground networks run in your existing GIS data.
What file formats does a mobile mapping survey produce?
Point clouds often come in the LAS format from ASPRS. Photos usually come as panoramas, while extracted assets arrive as GIS layers or shapefiles. These load into Esri ArcGIS, GE Vernova Smallworld or QGIS, based on the data model you agreed at the start.
How long does it take to process mobile mapping data?
It depends on network length, the number of asset types and the review level you need. Path processing is usually quick, while extraction and QA take longer. AI also cuts down manual drawing. Still, analysts check the exceptions before the data goes into an enterprise GIS.
Is a Mobile Mapping Survey Right for Your Utility?
A mobile mapping survey is the right choice if you need many roadside assets captured quickly and with known accuracy. Still, it works best as part of a wider data plan with control, extraction rules and QA.
If you need to list poles, lights and signs across a city or district.
Mobile mapping survey with AI extraction.
If your assets sit in open land, substations or off-road corridors.
Drone survey, perhaps with mobile mapping on roads.
If you need underground details or private sites.
Field survey and records digitisation.
If you only need to check a few hundred assets.
Targeted field data collection.
RedPlanet Solutions plans and delivers mobile mapping services for utilities and councils, from route design to GIS-ready layers. If you are scoping a survey for an electric utility network, we can help. For example, we can set needs, compare methods and run a pilot. So get in touch to talk about your network.
Expert Guides
Related GIS Guides
 GuideMobile GIS Data Collection for Utilities: Field Workflows That Cut ReworkMobile GIS data collection for utilities: form design, GNSS accuracy, offline sync, photo standards and QA at source that cut field rework.Read the guide →
 GuideLiDAR Feature Extraction for Utilities: From Point Clouds to GIS AssetsLiDAR feature extraction for utilities: how point clouds and imagery become GIS assets, with classification, AI tools, QA, accuracy and cost drivers.Read the guide →
Plan Your Next Utility Asset Survey With Confidence
RedPlanet Solutions designs mobile mapping, drone and field survey programmes that end in clean, GIS-ready asset data. Tell us about your network, and we will suggest the right capture and extraction approach.
Talk To Our GIS Consultants
PK Senthilkumar is CEO of RedPlanet Solutions. His work focuses on GIS consulting, network-based GIS for utilities, enterprise GIS modernisation and practical spatial decision-making for organisations operating across Malaysia, India, Australia and international markets.
About RedPlanet Solutions
RedPlanet Solutions (M) Sdn Bhd is a Malaysia-based GIS consulting and geospatial services company and part of RedPlanet Berhad. The company delivers GIS for electric utilities, spatial data collection, drone surveying, mobile mapping and GIS software development to utilities, government agencies, smart cities and private sector organisations across Southeast Asia, the Middle East, Australia and beyond. RedPlanet works across leading commercial and open-source GIS ecosystems, including GE Vernova Smallworld, Esri, Hexagon, SuperMap, QGIS, GeoServer and FME.