Schematising Service

Schematize refers to the process of structuring complex information into a clear, logical, and simplified format.

OVERVIEW

Schematization turns detailed data into visual frameworks, step-by-step flows, or organized categories so it’s easier to understand and communicate.

Why It Matters

The word ‘schematize’ comes from the Greek ‘schema’, meaning form or figure. As a verb, it means to arrange, represent, or interpret something according to a schema — a structured model or framework. A schematized view of any subject strips away unnecessary detail and presents the essential relationships, sequences, and structures in a form that is easier to understand, communicate, and act upon.

In technical and data-intensive fields, schematization is not just a communication technique. It is a core part of how complex systems are understood, documented, and managed. In GIS and geospatial project management, schematization is applied to everything from system architecture and data flow to deployment sequences and stakeholder reporting.

  • Enhances clarity by removing unnecessary complexity
  • Improves communication across teams and stakeholders
  • Supports better decision-making through structured information

In practice, schematization solves a problem that every GIS team and project manager faces: the gap between the complexity of a system and the ability of stakeholders to understand and act on it. A database schema, a network topology, a deployment sequence, or a regulatory workflow: each of these is genuinely complex. Schematization converts that complexity into a form that engineers, clients, and decision-makers can all work from.

The benefits are concrete:

  • Reduced onboarding time: New team members understand project architecture and workflows faster when they are presented as diagrams rather than written specifications.
  • Fewer miscommunications: Visual frameworks reduce the ambiguity that causes misaligned expectations between technical teams and non-technical stakeholders.
  • Better project planning: Schematized workflows expose dependencies and sequencing that are easy to miss in written documentation.
  • Stronger audit trails: Structured visual records of system design and data flow support regulatory reporting and compliance documentation.

Example in Practice

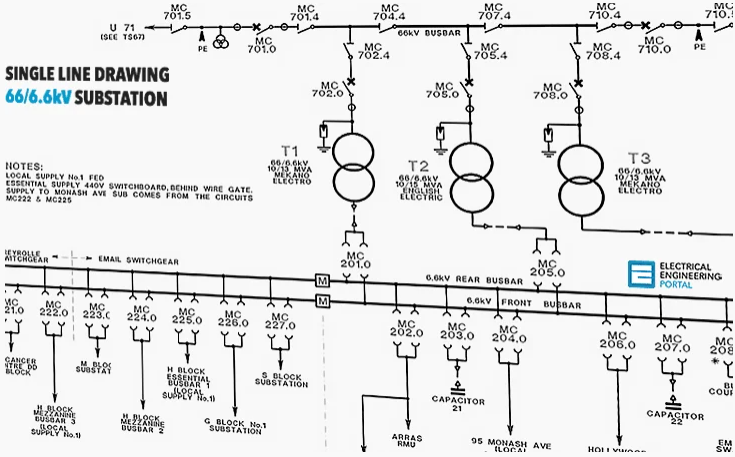
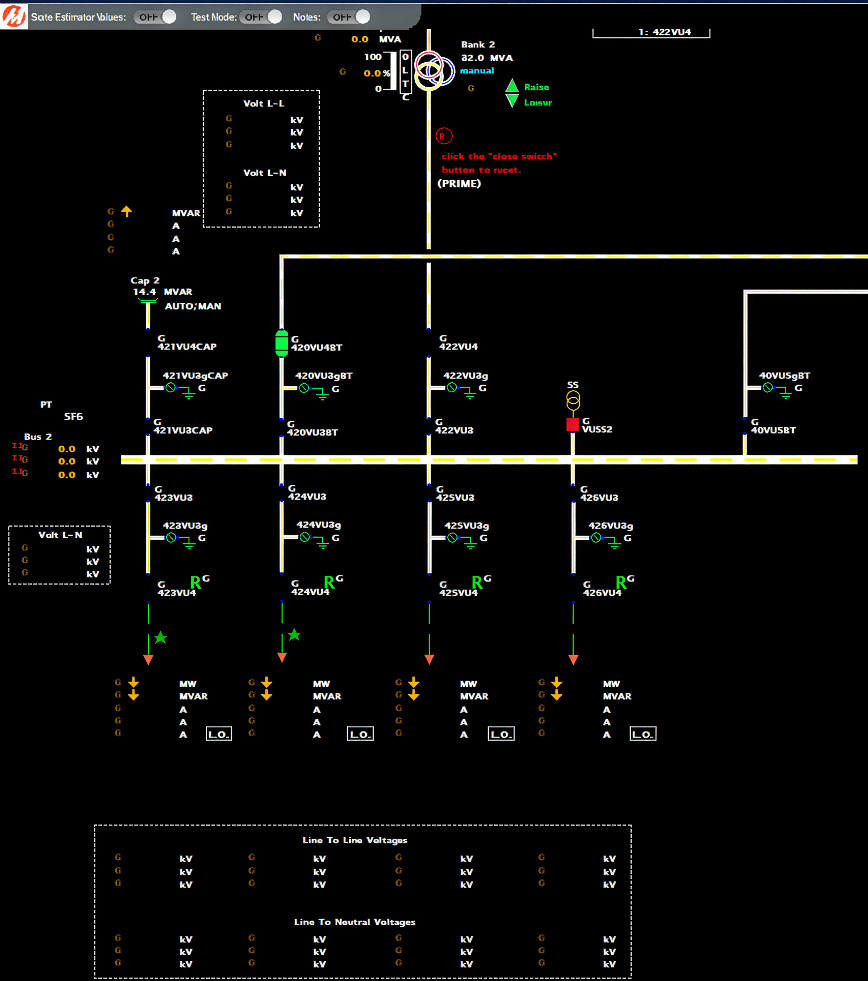
In our GIS and Project Management workflows, we convert complex system dependencies and technical sequences into clear, interactive diagrams. This allows teams to visualize the entire process from start to finish.

before-schematising-complex-gis-workflow-data.png
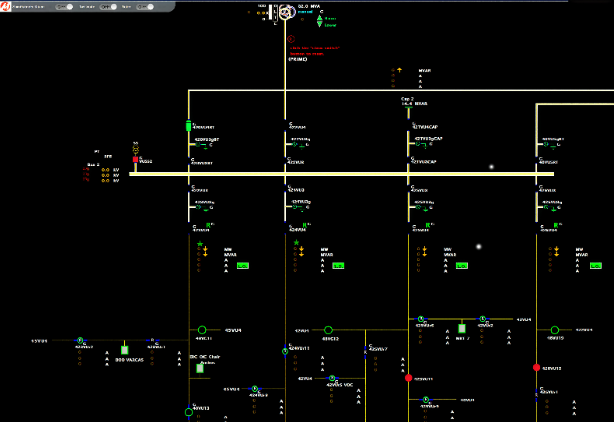
The two diagrams above illustrate the core value of schematization. The 'before' state reflects what most GIS projects look like in their raw form: a tangle of system connections, data dependencies, stakeholder requirements, and process sequences that are technically accurate but practically unusabl
after-schematising-structured-gis-workflow-diagram.png

The two diagrams above illustrate the core value of schematization. The ‘before’ state reflects what most GIS projects look like in their raw form: a tangle of system connections, data dependencies, stakeholder requirements, and process sequences that are technically accurate but practically unusable for planning or communication.

The ‘after’ state shows the same information reorganized into a structured visual model, with clear stages, defined dependencies, labelled components, and a logical flow that any team member can follow from start to finish. The underlying complexity has not been reduced; it has been made navigable.

How RedPlanet Applies Schematization in GIS Projects

At RedPlanet Solutions, schematization is a core part of how we design, document, and deliver GIS implementations. Complex spatial data ecosystems involving multiple GIS platforms, data sources, integration layers, and user groups, require structured visual documentation at every stage of the project lifecycle.

System Architecture and Data Flow Diagrams

Before any GIS implementation begins, we schematize the full system architecture: where data originates, how it is transformed and validated, which platforms it flows through, and where it is consumed. This gives every team member and stakeholder a shared reference point throughout the project.

GIS Workflow and Process Visualization

In utility GIS deployments covering electric, gas, water, and telecoms networks, workflows can involve dozens of interconnected steps: data capture, quality assurance, network modelling, work order integration, and reporting. We schematize each of these workflows so that field teams, system administrators, and project managers all operate from the same documented process framework.

Project Milestone and Dependency Mapping

For large GIS projects with multiple phases, vendors, and stakeholder groups, we produce milestone diagrams that show how each project component depends on others. This makes risks visible, prevents milestone conflicts, and gives clients a clear view of project progress at any point.

When to Schematize Your GIS or Project Data

Schematization is most valuable at four specific points in any GIS or technology project:

  1. Project kickoff: Before detailed design begins, schematize the current state of your data environment and the target architecture. This aligns the team on what exists and what needs to be built.
  2. Before stakeholder presentations: Complex technical specifications are rarely suitable for executive or client presentations. Schematize the key decisions, options, and dependencies into a visual summary that non-technical stakeholders can engage with.
  3. During system integration work: When connecting multiple GIS platforms, databases, or operational systems, schematize the data flow between them. This surfaces integration conflicts and sequencing requirements before they become costly problems.
  4. For documentation and handover: Every project should end with schematized documentation of the deployed system, including architecture diagrams, data flow maps, and process documentation. This is so that future teams can maintain and evolve it without starting from scratch.

These terms are related but not interchangeable. Here is how they differ:

  • Schematize: The broad act of converting any complex information into a structured, simplified visual or logical framework. It is the method; the result is a schema or schematized representation.
  • Process mapping: A specific type of schematization that documents the steps, inputs, outputs, and decision points within a defined business or technical process. All process maps are schematizations, but not all schematizations are process maps.
  • Workflow diagram: A visual representation of a sequence of tasks, approvals, and decisions within a workflow. Focused on sequence and role assignment within a specific operational context.
  • System architecture diagram: A schematized view of the technical components of a system, their relationships, and the data flows between them. Common in GIS and IT infrastructure documentation.
  • Data flow diagram (DFD): Shows how data moves through a system, from inputs, through processes, to storage and outputs. Used in database design, GIS data modelling, and system integration planning.

Tools Used for Schematization in GIS Projects

RedPlanet’s team uses a combination of GIS-native and general diagramming tools depending on the schematization task:

  • GIS platforms (Hexagon, SuperMap, QGIS): For schematising network topology, spatial data structures, and system architecture within the GIS environment.
  • Diagramming tools (Lucidchart, draw.io, Microsoft Visio): For process flows, project milestone maps, stakeholder communication diagrams, and system dependency charts.
  • GIS desktop applications: For creating data flow maps, layer dependency diagrams, and attribute schema visualizations from live GIS data.

Frequently Asked Questions

Schematize means to structure, arrange, or represent complex information as a schema. In data, technology, and project management contexts, schematising involves converting detailed or unstructured information into diagrams, process flows, or structured models that are easier to understand, communicate, and act upon.

Schematization is the process of converting complex data, systems, or workflows into structured visual representations. The output of schematization can include process maps, data flow diagrams, system architecture charts, or step-by-step workflow diagrams. In GIS and project management, schematization is used to document system designs, map data flows, and communicate project plans to technical and non-technical stakeholders.

Schematize is the verb — the act of structuring or simplifying information into a schema. Schematization is the noun — the process or result of doing so. In practice, you schematize a complex system to produce a schematization of it: a structured visual model that makes the system easier to understand and manage.

In GIS, schematization is used to document system architecture, data flow between platforms, network topology, project workflows, and integration sequences. Before deploying a GIS solution for utilities or telecoms, RedPlanet schematizes the full data environment, showing how data originates, is transformed, and flows between systems. This gives every team member a shared reference model.

Schematising a workflow reduces complexity to a manageable, communicable form. Key benefits include faster onboarding for new team members, fewer miscommunications between technical and non-technical teams, clearer identification of dependencies and risks, stronger documentation for audits and compliance, and a shared reference that keeps all project participants aligned from start to finish.

GIS schematization uses a combination of tools: GIS platforms such as Hexagon, SuperMap, and QGIS for spatial data and network topology diagrams; diagramming tools such as Lucidchart, draw.io, and Microsoft Visio for process flows and system architecture charts; and GIS desktop applications for data flow maps and attribute schema visualizations.

Need Help Schematising Your GIS Project?

RedPlanet Solutions includes structured visual documentation in every GIS and geospatial project we deliver. If your team is working with complex system dependencies, multi-platform data flows, or large-scale GIS implementations that need clear documentation and structured project frameworks, our team can help.

We work with utilities, telecoms operators, smart city agencies, and enterprise organisations across Malaysia, India, New Zealand, and the APAC region. We bring both the GIS expertise and the structured project methodology to deliver clean, well-documented implementations.

Speak to us today!

Explore how RedPlanet can help your organisation solve its data challenges. Speak to our team today.